
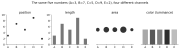
Encodings: Building Blocks for Visualizations
Visualizations are built by encoding data into visual properties: position, size, color, shape, and so on. Thinking in terms of these building blocks - rather than in terms of chart types - lets you decompose designs, compare choices, and invent new things. And one building block towers over the others: position. Spend it wisely.
Read more…