Visualization Snacks is my attempt to provide Visualization Knowledge in small, easily accessible pieces.
Warning: This is a pre-release version of the site. I am just putting up the shell with a few postings for my class.
Many people want help with Visualization, but don’t have the opportunity to take a class, or do extensive reading, or search through the endless resources. Many of the resources out there only work in the context of a larger chunk.
What I’ve found is the pieces I’ve created for the class I teach (CS765 Course Web) are not necessarily appropriate for anything other than the students in the class. Visualization Snacks is an attempt to put that kind of content into a form that may be more usable to others.
What you’ll find (the sections of the site)…
Snacks - these are the core “lessons” written explicitly for this site. The idea is to have a form that allows for quick consumption. The goal is to provide the main idea quickly, but then provide the background afterwards. The why follows the what.
Tutorials - these are written “documents” that were originally created for my class, or that don’t have the stylized form of the Snacks. They tend to be longer.
Critiques - are examinations of specific visualizations. The idea of a critique is to examine something closely to learn from it (not just to criticize).
Papers - are my summaries/discussions of papers (or other documents). The idea is that I read them, so you don’t have to. In some cases, it’s an opportunity for me to give you the short, informal version of something else I’ve written.
Resources - descriptions of books and other things that might be helpful.
A quick walkthrough of showing how to get started with Tableau. The data set is one we will use in CS765 Fall 2025: Life expectancy data from around the world. I won’t get as far as making “good” visualizations - but it will give you some hints on how to get started with the data set, and with Tableau.
This is a tutorial on how to get started with Tableau. It is targeted at CS765 students (but should be OK for anyone). I am using the Census dataset I used in my 2024 Class. The tutorial will walk you through what I did to make a few initial pictures. This will show you some of the quirks of Tableau and the dataset.
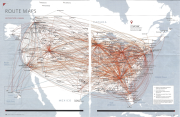
Let’s look at the “Airline Route Maps” (the ones that are in the back of an airline magazine) as a way to explore the importance of task and how understanding task and data can lead to novel designs. It will show us a different way to think about node link diagrams more generally.
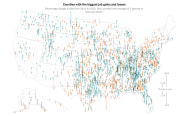
Core lesson: think about what a visualization makes easy to see. Different representations make some things easier, and harder. And be careful when dealing with geographic data in the US: populations and counties are spread unevenly.
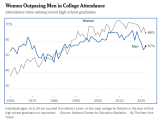
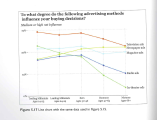
Don’t make the wrong thing easy to see. Here’s a real example from my own work where a seemingly innocent line graph was misleading and needed some serious redesign.
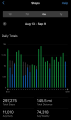
In this snack, we look at “value over time” graphs in two different iPhone apps. It’s a good opportunity to connect design and task with a comparative critique.
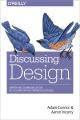
I believe that critique is a valuable skill for both practicing and learning Visualization (see Tutorial 4: Critique). The book Discussing Design is a great resource to learn it.
Critique is the practice of examining something carefully to understand it and learn, often in a “discussion” format. Critique is a key tool in learning about Vis, and in improving design (for Vis, and in general). It is also a generally useful skill that can be learned with practice.
This is the closest thing to a “primary textbook” for my class. The course shares a similar philosophy to the book, and we’ll read almost all of the chapters. The UW library has electronic copies, so students do not need to buy it.
Alberto Cairo is a designer and journalist who has become a visualization educator. He has written some excellent books on visualization. I use excerpts from his books “The Functional Art” and “The Truthful Art” in my class.
Jacques Bertin was a French cartographer who had lots of ideas about visualization before there was a field of visualization. Many of the ideas we use in visualization today can be seen in his work, although reading these “original sources” can be challenging.