Reading 2: Overview

January 18, 2010

in Assignments

due before Tuesday, January 26

The goal of this reading is to give you an overview of what visualization is about. I’d like you to read at least one of the book chapters listed and (if I am able to get the scan in time), a chapter from Tufte who comes at it from the design perspective.

While these readings are focused on infovis, it does give a nice overview of the general topic:

  • Tamara Munzner. Visualization. Chapter 27 of Peter Shirley, Steven Marschner et al. Fundamentals of Computer Graphics, 3e. AK. Peters, 2009.

This is a chapter from the 559 textbook (if you took CS559 this year and have the new edition of the book). Otherwise, Tamara has a PDF of the chapter on her page here. Or, I have a copy in the course protected directory here. (see the posting about the protected directory).

An additional/alternative reading is the first chapter from the “original” infovis book. In some sense, this is a better chapter, but its also a little dated. There is a scan of it in the course protected directory here.

  • Card, Mackinlay, Schneiderman. Information Visualization. Chapter 1 of Card, Mackinlay, Schneiderman, Readings in Information Visualization: Using Vision to Think. Morgan Kaufman (Academic Press), 1999.

I’d also like you to read the first chapter of Tufte’s book series:

  • Edward Tufte. Graphical Excellence. Chapter 1 of The Visual Display of Quantitative Information. 2nd edition (any edition is OK). Graphics Press, 2001.

A scan of this chapter is in the protected directory here.

There is an assignment that is due the same day, independent of this reading (here).

Please leave a comment on which ones you’ve read, and any thoughts you have. If you read both of the InfoVis ones, I’m curious which one you prefer. If you read an infovis one and Tufte, you might comment on how different the “Visualization Scientist” perspective is from Tufte’s “Designer” perspective.

Since the reading is posted late, I understand that not everyone will get to the Tufte reading. If you don’t read it before class, please read it afterwards.
The First Day

January 17, 2010

in News

The beginning of the semester is here – and the web page, course syllabus, etc. really is not 🙁

A lot of things have not yet been worked out. This includes how we’ll handle people who are not enrolled.

Come to class the first day – 11am Tuesday 1/19, room 3359 Engineering. Hopefully, we’ll figure it all out together once we see who shows up.

Note: that after the first day, class will be moved to 1207 CS.

This assignment is due before Tuesday, January 26th. (we’ll check sometime Tuesday morning before class, and read them to help organize discussion on that day).

The purpose of this assignment is to 1) introduce ourselves to each other and 2) test out some of the mechanics for the class.

Knowing about the people in the class (this isn’t just the instructor knowing, but knowing each other) is particularly important for this class since we want to use the diversity of the backgrounds in the class to our advantage – we all come with different perspectives, problems to solve, and ideas.

So, please make a posting to this web (using the “new post” feature) in the “Student Posts” category with your name as the title. Add “Biography” as a tag. (the use of tags as a way of organizing assignment handins is an experiment here). In the post please:

  1. Say a bit about yourself. At the least, what department you are in, where you are in your career (e.g. 3rd year grad student or dissertator), what kinds of things you do for your “main work” (or if you’re a new student, what your interests are).
  2. Say a bit about your interest in visualization. Describe where you see yourself in terms of the “3 perspectives” we discussed in class (Domain Scientist, Designer, Vis Scientist). Do you have any thoughts as to what you expect to get out of the class?
  3. Say a little bit about your skill set. What are your programming and design skills? (this will be useful in trying to help adjust assignments and projects to fit people’s abilities).
  4. Optionally, add a picture (I think you should be able to), and a link to your personal web page.

You can say more if you like.

Notes:

  1. If you don’t want your post to be public (that is, that the whole world can read it), you can make it readable by subscribers only. I’m pretty sure we can do this, but since I’m new to workpress, this is something I’ll have to work out.
  2. You should have registered for the web site for assignment 1, and the TA should have promoted your account to “Contributor” so that you can make posts. If you can’t make posts, contact the TA.
  3. As a contributor, you can create a posting, but the TA or instructor (the moderators) must approve it before it gets posted. We’ll try to check to make sure its tagged and categoried correctly, but try to get that correct.

Looking at classes at other universities is a great way to get a sense of the field. I have definitely spent a lot of time looking at other places to get ideas for this class. Sadly, we can’t make use of all of the good ideas.

  • Maneesh Agarwala’s CS294 class at UC Berkeley. This is one of my main inspirations.
  • Hanspeter Pfister’s CS171 class at Harvard. Was a primary inspiration for doing this class.
  • Colin Ware teaches a class a the University of New Hampshire. He’s the author of the best textbooks, so his class was certainly one to look at. 
  • Victoria Interante had an interesting class at Minnesota, but the web page seems to have gone away.
  • David Ebert at Purdue teaches a class that’s a little more broad than some of the others (including more traditional “scientific” visualization).
  • Tamara Munzer’s class at University of Brittish Columbia
  • Hanrahan
  • Marti Hearst’s class at Berkeley.

This is the NEWS page

January 16, 2010

in News

The news page – or a list of announcements that seem important. Please also check out the BasicInfo page for basic course information.

The main readings for this class will be provided (they will come from papers, or book chapters that I can provide). However, I was going to use so much of Colin Ware’s book, that it defies academic fair use, so itis a required textbook.If you don’t want to buy it, it will be on reserve at Wendt library.

Required Textbook:

Visual Thinking: for Design, by Colin Ware. Published by Morgan Kaufman, 2008. ISBN-13: 978-0123708960. (amazon)

This is a fabulous book. We’ll use all of the chapters. The only downside is that it isn’t as comprehensive as his earlier book. But I picked this one since Information Visualization might be a little bit too much for some people.

There will be required readings from this book, but there will be alternates for those of you who buy Information Visualization instead.

Alternate Textbook:

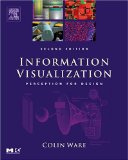
Information Visualization, Second Edition: Perception for Design, by Colin Ware. Published by Morgan Kaufman, 2004. (amazon)

This was going to be my choice for the textbook, but I thought it might be a little much for most students. If you’re really into visualization, you probably want this book instead of Visual Thinking.

Another Useful Book


Visualizing Data. by Ben Fry. O’Reilly 2008.

This is less a book about visualization than it is about the process of doing visualizations and how to program in Processing. If you’re not a computer scientist, and you need to learn some simple programming to do some visualization, this book is a good place to start. Its more about working through the process of simple examples than giving you insights into visualization in general.

You don’t need to buy this book – UW has access to an online copy (here’s a link that accesses it through the proxy so it works off campus): http://ezproxy.library.wisc.edu/login?url=http://proquest.safaribooksonline.com/9780596514556

Recommended Reading

Tufte’s books are an essential guide to the design aspects of visualization. Its hard to justify them as textbooks. I have requested that they be put on reserve at Wendt.

The Visual Display of Quantitative Information, 2nd edition. By Edward Tufte. Graphics Press, 2001. (amazon)

Envisioning Information. By Edward Tufte. Graphics Press, 1990. (amazon)

Visual Explanations: Images and Quantities, Evidence and Narrative. By Edward Tufte. Graphics Press, 1997. (amazon)

Beautiful Evidence. By Edward Tufte. Graphics Press, 2006.  (amazon)

At the surface, Scott McCloud’s books seem to be about comics. But, if you dig deeper, you realize that he has a lot of amazingly insightful things to say about visualization in general.

Understanding Comics: The Invisible Art. by Scott McCloud. Harper, 1994(amazon)

I don’t think people would take me seriously if I made this a textbook. But you’ll learn a ton by reading it. It will help you rethink what visual communication is about. His new book seems good too, but I am just reading it now.

Making Comics: Storytelling Secrets of Comics. by Scott McCloud. Haper, 2006.

due before Thursday, January 21st.

This first assignment has three goals, which make it a little different than the typical reading:

  1. To read and learn from a particularly good paper – not just because the system they describe is good, but because its a nice account of the entire vis processs.
  2. To get a handle on how the diversity of the class can cope with reading Computer Science papers. For many of you in other disciplines this might be the first technical CS paper you’ve read.
  3. To test out some of the class mechanics.

The reading for this assignment is the paper:

  • Meyer, M.   Munzner, T.  and Pfister, H. MizBee: A Multiscale Synteny Browser. IEEE Transactions on Visualization and Computer Graphics, 15 (6) 2009. Proceedings Infovis 2009. doi:10.1109/TVCG.2009.167

You can get the paper from the authors website here. There is other information (including a video and actually downloading the program to play with it) at the website. But for this assignment, it is particularly important to read the paper. Part of the reason for this assignment is that I think this is a particularly illustrative paper.

Here’s the assignment:

  1. Read the paper and be prepared to discuss it in class on Thursday, January 21.
  2. Register for this website (you’ll just have “subscriber status” – but that will enable you to comment on postings. we’ll upgrade your membership manually once you are subscribed).
  3. Post a comment to this assignment post with some thoughts about the paper. You can also begin a dialog with others (by replying to their comments, etc.), but each person should post their thoughts.

Send and email to both the instructor and TA listing the things that you didn’t understand in the paper. To a computer scientist (who knows a little bit about genetics), this paper is easy in terms of the technical content. But I am trying to gauge how it is for others to read papers like this. I am looking for background that you don’t think you have, terms that you can’t understand (if you had to look something up), concepts that you felt like you needed before reading this paper, … If the paper was totally understandable to you, please say that. (everyone needs to send this email).

Please do this (all 3 parts) before Thursday, January 21st. I am going to look at what people wrote on Thursday morning and use it to plan class, so make sure that your comment and email has been done.

This is another posting from Test Student. It will be put into a category and have comments enabled.

This course web is running in WordPress – this is an experiment for me.

Part of the idea behind using WordPress is that it should give us an easy way to have a collaborative web page – that is one where students can make contributions, and we can use it as a mechanism for class participation. Therefore, as a student in class you may need to know a little about how wordpress works.

Getting an Account:

Things are set up so that you can create your own account as a “subscriber”. A subscriber has limited access – they can read everything, and can comments on posts where commenting is allowed.

Once you’ve created your account, the instructor or TA will promote your account to be a “contributor”.

What you can do:

For some posts (generally not on “News” or “BasicInfo”) you can add comments – this will be an important mechanism for class. For example, you will be asked to write comments on postings about readings.

You can write posts, however, since you are a “contributor” (in WordPress speak), your posting must be approved by an administrator (the instructor or TA) before it appears. Unlike the standard WordPress setup, you can upload pictures to go along with your posts. We will use student posts for things like “Visualization of the Day” and project ideas postings.

If you have ideas on how we can make things better, tell the instructor. Be warned: you might be volunteered to implement your idea.

Categories are the key organizing principle. The list of categories is on the right sidebar.

About this WordPress Setup

Students will be given “Conrtibutor” Accounts.

Some tweaks that have been made:

  • The “uncategorized” category is not shown in the categories widget by implementing the hack here.
  • The “OptInFrontPage” plug in is used so that only news appears on the home page.
  • The “WPFrontPageBanner” plugin is used to add to the front page.
  • Its using the “Thesis Style” – that I paid for. I’m still learning to tweak it.

Course Announcement

December 27, 2009

in BasicInfo,News

The original course ad can be found here.

Course Announcement for Spring 2010:
CS838: Visualization: getting from data to understanding

Spring Course Announcement:
CS838: Visualization: getting from data to understanding

Instructor
Mike Gleicher
Time
Tuesday/Thursday 11-12:15
Prerequisites
none
Intended Audience
students who work with data and need to use visualizations effectively and students who are interested in creating tools to help people work with data
Credits
nominally 3, but variable credit possible (especially for dissertators)

Please contact the instructor if you are interested.

This course will explore the foundations of visualization: how we turn data into pictures to help in understanding or communicating it. We’ll cover visualization in the broad sense: including scientific visualization, information visualization (the presentation of abstract data), and visual analytics (the use of interactive tools for exploring large and/or complex data sets).

The content (the topics, not the teaching style) of this course is modeled after the visualization courses at Harvard (cs171) and Berkeley (cs294). Here, we will teach the class in a bit more of a “seminar” style – using class time more for discussion and student presentations than lectures.

Overview

Visualizations range from crayon sketches on the back of a napkin to immersive virtual reality display of the fluid dynamics around an airplane; from a bar chart in excel to a fancy, realistic 3D model.

Our goals are to understand the principles that lead to effective visualizations across this range (design, the use of color and motion, basic design patterns, dealing with high-dimensional data, …), specific visualization designs and problems (treemaps, scatterplot matrices, focus+context, volume visualization, …), as well as looking at the kinds of systems and tools that support the creation of good visualizations.

By the end of the course, we will learn how to design effective visualizations for the kinds of data we want to interpret and understand the kinds of tools that support the creation of such visualizations.

For a more complete description, I steal this from the course at Berkeley (with 2 sentences removed):

In this course we will study techniques and algorithms for creating effective visualizations based on principles and techniques from graphic design, visual art, perceptual psychology and cognitive science. The course is targeted both towards students interested in using visualization in their own work, as well as students interested in building better visualization tools and systems. In addition to participating in class discussions, students will have to complete several short programming and data analysis assignments as well as a final project.