Student Posts

I think this is an elegant way of displaying connections between a huge dataset.  To explain, this is a haplotype map that has SNPs (single nucleotide polymorphism) at the top (where it is feathered). They then study the genes of a population to determine the probability that SNPs occur together (called linkage disequilibrium. If you take two white squares at the top, and then draw lines parallel to the triangle to get an intersection, you get a square that represents that probability. A higher probability (closer to 1) is colored red. A probability that approaches random (.5) is white, with blue being slightly better than random and light red being between red and blue.

This means that triangles of mostly red, which are marked off in these plots, are those SNPs which are more likely to be passed on together during chromosome crossover. In the Caucasian sample, there are many more of these than in the Yoruba sample, which implies that any mutation that added something new to the gene pool happened more recently for Caucasians than Yoruba, as more crossovers (more generations) means less linkage disequilibrium.

These graphs are specifically of chromosome 8p23.1 and is for a 100kb region.

HapMap

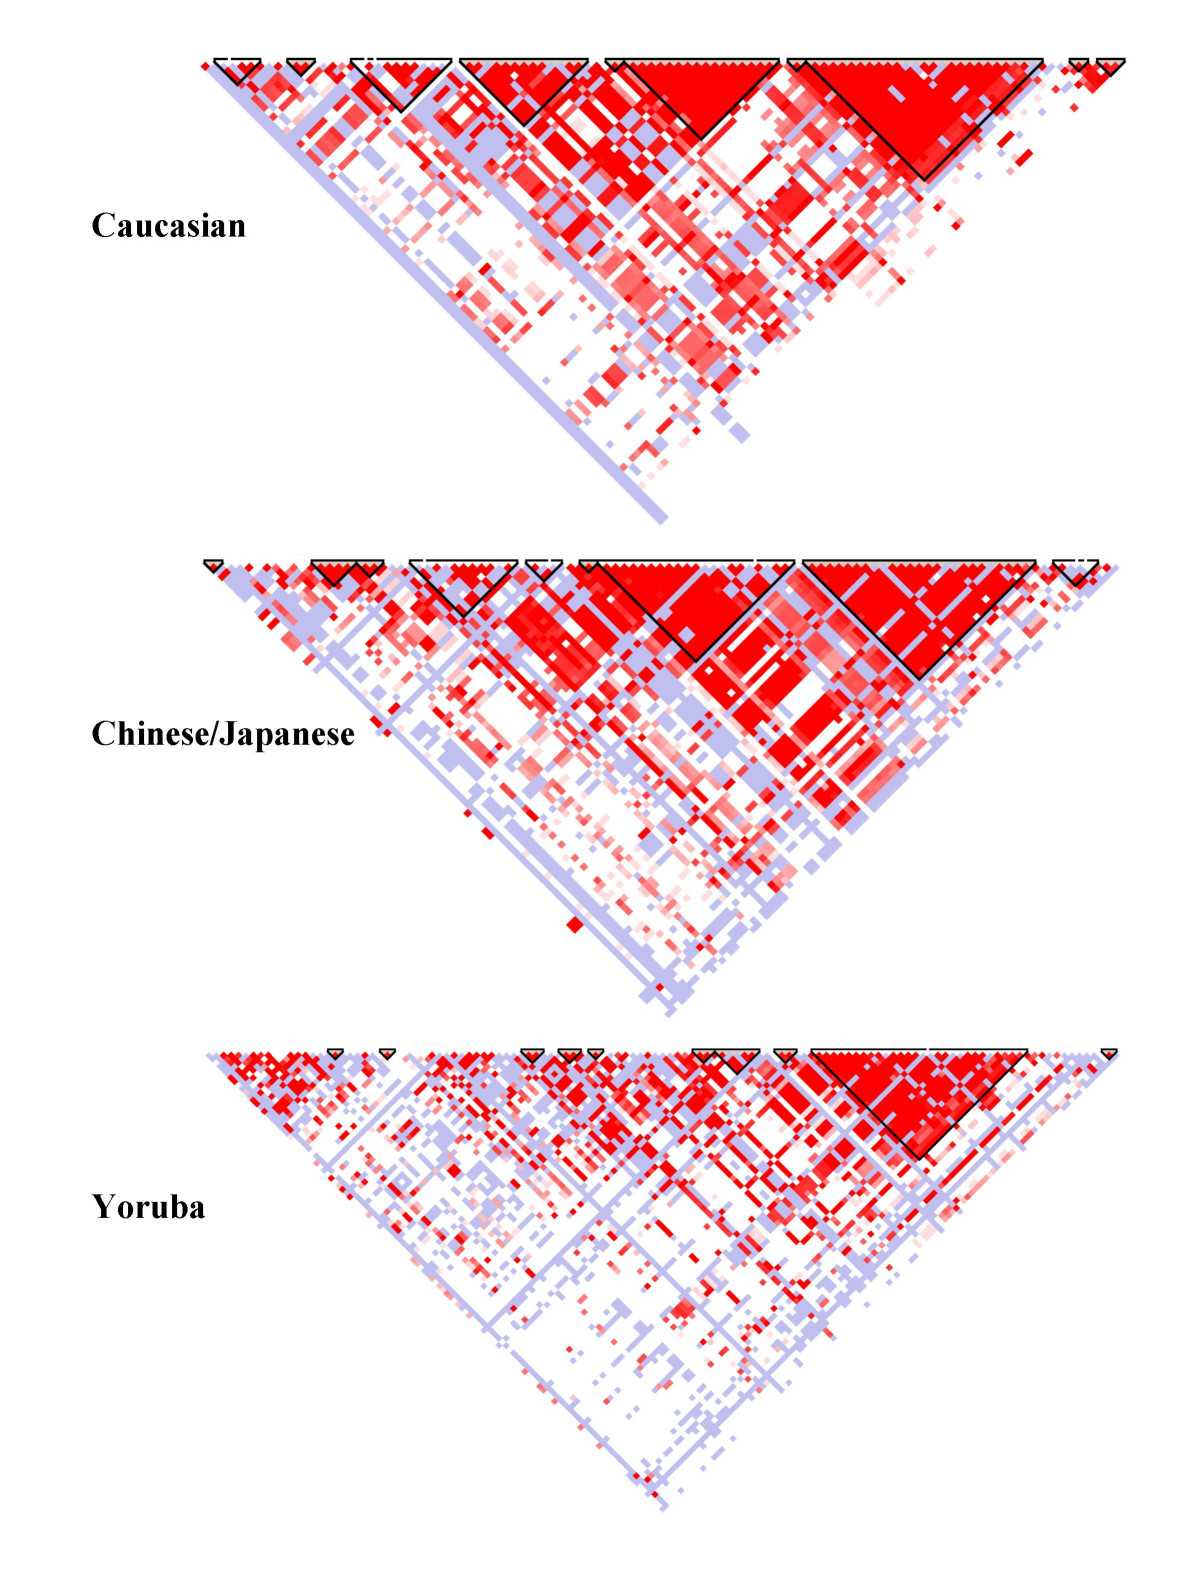
The intended audience are those with an understanding of biology and the human genome. It allows you to see, at a glance, genes or SNPs which are connected. This encodes probability to color, and uses position as a way of filling in the matrix connecting two values. The positions along the top of the triangle is mapped to position in the chromosome itself. I think it is good because you can clearly see the connections between different SNPs and regions with are likely to stick together during the recombination required to create gametes. It also is simple to glance between different HapMaps of the same chromosome in different populations and see which has had the most recent mutation (and therefore less time to be more random in the population).

The Good

February 10, 2010

in Critiques,Student Posts

The Cost of Care

http://blogs.ngm.com/blog_central/2009/12/the-cost-of-care.html

This visualization compares cost of healthcare per person to average life expectancy for various developed countries. This text is included on article linking to the actual image:

“The United States spends more on medical care per person than any country, yet life expectancy is shorter than in most other developed nations and many developing ones. Lack of health insurance is a factor in life span and contributes to an estimated 45,000 deaths a year. Why the high cost? The U.S. has a fee-for-service system—paying medical providers piecemeal for appointments, surgery, and the like. That can lead to unneeded treatment that doesn’t reliably improve a patient’s health. Says Gerard Anderson, a professor at Johns Hopkins Bloomberg School of Public Health who studies health insurance worldwide, “More care does not necessarily mean better care.”  —Michelle Andrews

This visualization encodes four dimensions of data in the following ways:

–       Cost of healthcare per person- y position

–       Average life expectancy- y position

–       Average number of doctor’s visits per person- line thickness

–       Type of coverage (universal or otherwise)- hue

What Munzner might say:

Cost and life expectancy clearly fall into the quantitative data category, and are encoded using position, the strongest visual channel for their data type. Type of coverage is categorical, and is encoded using hue, the second strongest visual channel for its data type (after position, which has already been used).  All the visual channels are seperable, and code these four dimensions without confusion. Also, cost and life expectancy are connected by lines, so their relationship is encoded using line slope. Clearly and explicitly relating this data makes the US pop out as the country with the steepest downward slope.

What Tufte might say:

First, this graphic is well documented. The creator, his position, the data source, the year the data was collected, the fact that some countries aren’t shown, and the scales for all the numeric data are all clearly written on the image. The lines connecting cost and life expectancy facilitate clear comparisons of all the data.

Edit: Here’s an interesting article where the creator justifies his design choice over a scatterplot: http://blogs.ngm.com/blog_central/2010/01/the-other-health-care-debate-lines-vs-scatterplot.html

The Bad

February 10, 2010

in Critiques,Student Posts

Trends and Technology Timeline 2010+: A roadmap for the exploration of current and future trends

http://nowandnext.com/PDF/trends_and_technology_timeline_2010.pdf

This visualization denotes current trends as well as predictions for future trends, and displays them in a way that is analogous to a subway map. This text is included on the map:

“This map is a broad representation of some of the trends and technologies currently visible. Improvement works are carried out at weekends and travellers should check to see whether lines are still operable before commencing any journeys. Helpful suggestions concerning new routes and excursions are always welcome.”

This visualization encodes five dimensions of data in the following ways:

–       “time zones”– radial distance from the center of the map, hue

–       phenomena – text labels, position on category lines, connection?

–       category of phenomena – hue

–       type of phenomena – shape, glyphs

–       global risks – bulleted list, containment?

What Munzner might say:

First of all, this “roadmap” doesn’t even use the strongest visual channel(s): absolute x and y position. Then, it uses hue to distinguish different time zones (even though this is ordered data, and saturation would be more appropriate), AND to distinguish different categories. And there are 16 different colors corresponding to different categories, even though the max amount of colors used should be eight.

What Tufte might say:

What is meant by “time zones”? The common definition of this word is very different from the definition as relates to this visualization. Also, trends appear on category lines in a particular order. Is there any logic behind this order? Does it imply causality? Finally, the extremely dense text doesn’t make very judicious use of ink.

The problem of displaying a data set that is multi-variate, time-varying, and comparative in nature is inherently very difficult. Jonathan Woodring and Han-Wei Shen at Ohio State have developed a very aesthetically pleasing method of displaying such information using three dimensional color mapping. However, their solution leaves a lot to be desired in terms of the composition of a successful visualization. While the colors do make for very visually pleasing images, the visualizations themselves are very difficult to interpret. The value of any given data point is encoded in its color and its position is representative of its relation to other data collections as defined by a set vocabulary of logical operations that the tool can visualize (over, in, out, atop, and xor). In addition to the limitation on the amount of data that is provided, the visualization provides the user with neither manner of inferring what the values encoded by the color actually represent nor a physical representation of the meaning of the positioning coordinates. Essentially, the user has no manner of extracting any data out of the visualization other than two points being different over one dimension or another. A user simply looking at the output of this visualization cannot really gain much from the end result other than a pretty picture generated from a complex data set. This visualization technique seems to have potential, but in it’s current state, it is simply not a very useful mechanism for data comparison.

Above is an image of a visualization generated by this tool representing a logical combination of data points from the Supernova Initiative Data Set. The paper and additional images can be found here.

I know most of our examples are from the digital world, but this is very cool indeed: a paper map, zoomable by virtue of clever folding:

http://www.thezoomablemap.com/

Hans Rosling’s TED presentation on international economic development issues. Pure genius of information visualisation, transforming time-series changes into a kind of sportscasting.

http://www.ted.com/talks/hans_rosling_shows_the_best_stats_you_ve_ever_seen.html

These seem like great additions to anyone’s library.

Programming the Semantic Web

Beautiful Data: The Stories Behind Elegant Data Solutions

More at the author’s blog at http://blog.kiwitobes.com/

http://www.nytimes.com/interactive/2010/02/01/us/budget.html

A classy way to see where $3.7 trillion is going to go, and how it’ll be different from this year.

Faisal Khan

January 26, 2010

in Student Posts

I am second year graduate student in computer science department. I have been working in distributed computing for a while now. Basically through my job before coming here and also as a research assistant in this department. I recently became more interested in compter vision and machine learning. As, I am in early stages of learning these fields I can not really say what kind of visualization challenges are involved. Apart from this I will also be interested in applying visualization techniques to data outside my domain.  This way I guess I  come in between the domain scientist and vis scientist.

I expect to learn some good design patterns for a wide set of data-sets with varying dimensions, scale etc. This might be very helpful as I am still not sure exactly the visualization challenges I might face. Additionally, I would also like to know about the recent trends in visualization research and about some useful visualization tool-kits. I am also looking forward for getting some hands on experience through assignments or project.

As for programming and design skills are concerned, I have a good amount of experience with handful of programming and scripting languages. I haven’t done much on the design side and not much work related to 3D graphics either. The main visualization experience is with system admin tools for visualizing network and cluster activities etc.

Danielle Albers

January 26, 2010

in Student Posts

Hi all! I am a first year graduate student in Computer Science. I’m currently interested in graphics and artificial intelligence. My research is geared toward creating large-scale visualizations with specific focus on the visualization of aligned genomic sequences.

Since my research is vis-based, my interests in visualization are to better understand it as both an art and a science. There is a lot of really cool work currently being done in the field. I’m looking forward to getting more exposure to the wide range of visualization techniques currently in use. Generally, in terms of the visualization perspectives, I spend the bulk of my time in the Vis Scientist category in addition to giving a fair share of attention to the Designer aspect of things. From this class, I hope to get a better understanding of the Designer/Domain Scientist aspects of visualization through our class discussions and to get a better understanding of how to compose effective visualizations. I have a fair bit of programming experience in a variety of languages and have some design experience, mostly in the web domain.

cs.wisc.edu/~dalbers [not a good example of web design, but oh well 🙂 ]