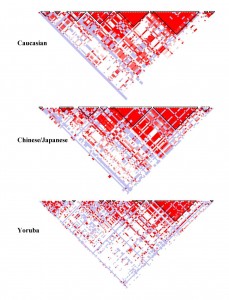
I think this is an elegant way of displaying connections between a huge dataset. To explain, this is a haplotype map that has SNPs (single nucleotide polymorphism) at the top (where it is feathered). They then study the genes of a population to determine the probability that SNPs occur together (called linkage disequilibrium. If you take two white squares at the top, and then draw lines parallel to the triangle to get an intersection, you get a square that represents that probability. A higher probability (closer to 1) is colored red. A probability that approaches random (.5) is white, with blue being slightly better than random and light red being between red and blue.
This means that triangles of mostly red, which are marked off in these plots, are those SNPs which are more likely to be passed on together during chromosome crossover. In the Caucasian sample, there are many more of these than in the Yoruba sample, which implies that any mutation that added something new to the gene pool happened more recently for Caucasians than Yoruba, as more crossovers (more generations) means less linkage disequilibrium.
These graphs are specifically of chromosome 8p23.1 and is for a 100kb region.
The intended audience are those with an understanding of biology and the human genome. It allows you to see, at a glance, genes or SNPs which are connected. This encodes probability to color, and uses position as a way of filling in the matrix connecting two values. The positions along the top of the triangle is mapped to position in the chromosome itself. I think it is good because you can clearly see the connections between different SNPs and regions with are likely to stick together during the recombination required to create gametes. It also is simple to glance between different HapMaps of the same chromosome in different populations and see which has had the most recent mutation (and therefore less time to be more random in the population).

{ 1 comment }
This type of visualization obviously requires some domain knowledge prior to viewing in order to understand the representation of relationships and pairings. On one hand, the visualizations give a quick overall impression of the density of similar data. However, it’s tough to extract any values (specific or general) from the visualization and it seems this type of image is great for comparison but may not be suitable for stand-alone viewing.
One potential way of increasing the comparative nature of this type of visualization could be to stack the images and allow the user to interactively adjust the opacity of each layer to see the differences. Overall, I think the utility of HapMaps could increase if the underlying data were used more for labeling or reference.