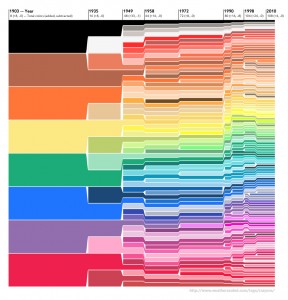
Crayon Chart:
Problem: Show the additions and changes to the manufactured crayon colors over the last 107 years
Abstraction: Color and time
Encoding: Color is mapped to both color and position, and time is mapped to position.
Implementation: Vector (likely) based static image
The original graph uses color to represent the actual color of the crayons. This literal use of variables is similar to mapping position to spatial data, where the required level of interpretation by the reader is reduced through the lack of non-intuitive associations. Improvements were made by including additional data on the top of the graph denoting the number of total colors, along with the number of colors added and subtracted, for each time stamp. The additions increase the visual noise, but allows the reader to extract data easily.