Puneet & Danielle
Deconstructing Multivariate Volumetric Vis
——————————————
Problem: Display the relationship between two different sets of multi-variate data in a single view.
Abstraction: The relationship between the two data sets is abstracted into a function of the predefined logical operators over the data set. The likely reasoning for this choice is to simplify the expression of the relationship of the data across a large number of variables. The exact values of the data are presented over a relative scale with respect to one another, again most likely in order to simplify visual representation. These abstractions are very logical decisions as far as simplifying the display and interpretation of a complicated body of data given that the purpose of this tool is more to demonstrate that such data can be shown, not necessarily in the most detail-oriented manner possible.
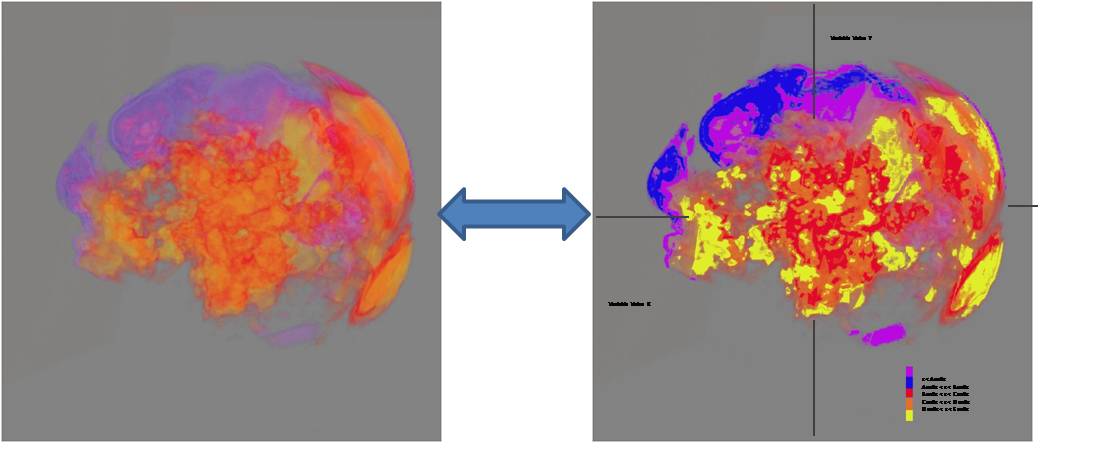
Encoding: The value of the variables is mapped to color. This is a fairly logical choice assuming an appropriate mapping of value to color. Additionally, the relationships of the variables between the data sets as expressed by the logical function are mapped to position. This decision appears to be motivated by the spatial nature logical expressions used to compare the data sets, implying a spatial relationship between data encoded in a spatial mapping.
Implementation: Generate a visual volume created by the above encodings in a digital format.
Suggested improvement:
While the visualizations generated by this system result in very aesthetically pleasing images, the outputs in their current state mean nothing. The encodings themselves have been abstracted to solely a relational level, but the nature of this relationship is left completely unspecified. One possible improvement for the representation is to map the values over an absolute and explicit color scale, with distinct visual intervals such that different data intervals are perceptually distinct from one another.
Additionally, the positional encoding of the data is completely uninterpretable at present. Essentially, the points mapped to the volume are mapped without regard for the user as there is no way to abstract any significant detail about the positional relationships from the visualization. One possible choice to improve the positional encoding of the data within each data set would be to give an explicit dimensionality to the different variables encoded in position in order to complement the spatial relationships encoded in the defining relational function.
These changes would likely detract from the aesthetics of the original image. However, they would make the visualization interpretable. By adding more explicit data to clarify the encodings, the visualizations become more about the information than art. Ideally, unlike the included redesign, transparency in the colors would be retained in order to maintain the volumetric aspect of the visualizations. However, by integrating more information about the encodings into the actual visual space, the reader can better understand what information is being presented. This new, more informative encoding could also then be implemented over an interactive platform to allow the user to navigate through the visualized data set. This sort of experimentation, however, was not done for this assignment.