Puneet & Danielle
Problem -> abstraction -> encoding -> implementation
Munzner describes the above process as ‘domain problem characterization, data/operation abstraction design, encoding/interaction technique design, algorithm design’
Deconstructing Walkscore
————————
Problem: Assess livability of a neighborhood by how far one has to walk for different services. The idea is that places you would usually walk to — parks, neighborhood grocery stores, restaurants and coffee shops — make up the social fabric of a neighborhood.
Abstraction: Livability is abstracted to availability of different services within walking distance.
Encoding: Map position to position, distance to color
Implementation: Show the results on a map.
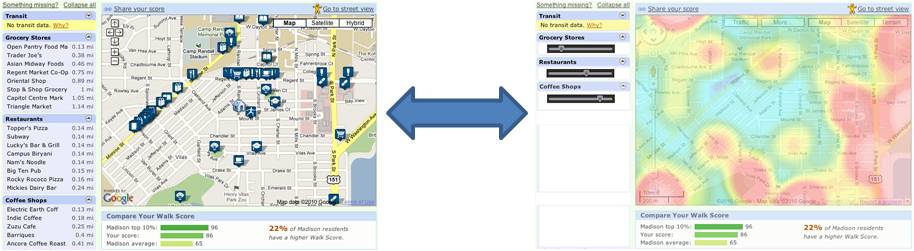
Suggested improvement: Walkscore is a wonderful way to visualize and assess livability of a neighborhood. The improvements I can think of are: a heat map that creates a color gradient from green to red, where greener is closer and redder is farther from the origin. Ironically, Walkscore does implement a heat map, but only as a pre-created map for certain neighborhoods. As far as I can see, it does not have a facility for the users to create one for their own neighborhood.
An additional interface element to implement would be to weight the various walking destinations — for some, having a grocery store within walking distance may be more important, while for others, existence of neighborhood coffee shops or parks where neighbors gather may be more important. Being able to move sliders for various destination categories and watching the heat map change in real-time would be one one meaningful improvement that I can think of.
With this change, the user does not necessarily get a better or worse view of the information, but simply is presented with a different interpretation. If someone were looking to explore a particular area, the original encodings would be ideal to use. However, if someone was looking to make a decision about a location based on factors important to them, the heat map would provide a very straightforward basis for such a decision.