Group members: Nate Vack and Adrian Mayorga
For the bad dataset we chose the eye data visualization that Nate posted about. The mappings are as follows:
Data:
- List locations with associated times
- Areas of interest
- The image itself
Mapping:
- Locations and times are aggregated into “fixations”
- (x,y) position, time, duration
- Areas of interest map to shapes
- Image maps to itself
Visual Encoding:
- Fixations are encoded by red circles.
- center of circle is x,y position
- size of circle is duration
- sequential fixations are joined by a yellow line
- Areas of interest are indicated by green shapes( ellipses , rectangles)
There are a few obvious flaws for these mapping and encodings. For one, mapping duration to size of circle is very misleading, it implies that when the fixation is longer, the area looked at is bigger. Additionally, it is not obvious that aggregating and thresholding the raw data into fixations is the correct thing to do in all cases. The thinness and color of the lines also causes them to sometimes blend into the background image, making it hard for the investigator to see what’s going on.
We have come up with alternative encodings that we feel address these problems.
The first is to just draw the raw data as a continuous line over the image.
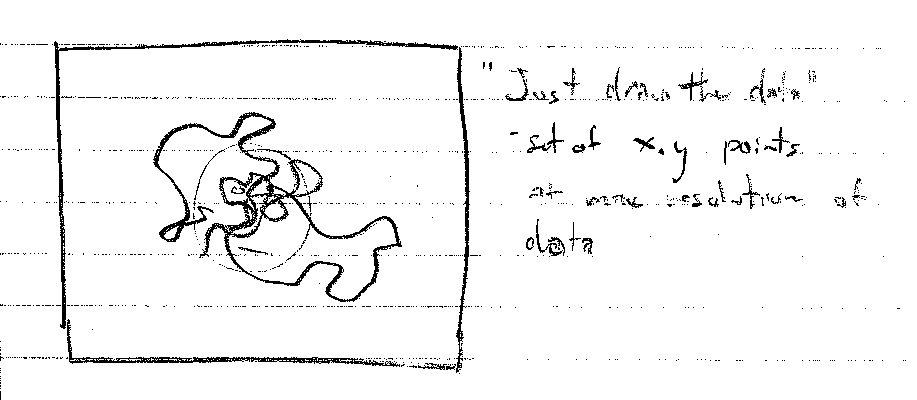
This is essentially the same mapping, but skipping the aggregation step. Since each point now represents and equal amount of time, representing duration directly is not needed. Implicitly, the time spent in a region will be represented by having a higher density of lines.
The second is to “fog up” the entire image. Then “clear” the areas where the subject looked.
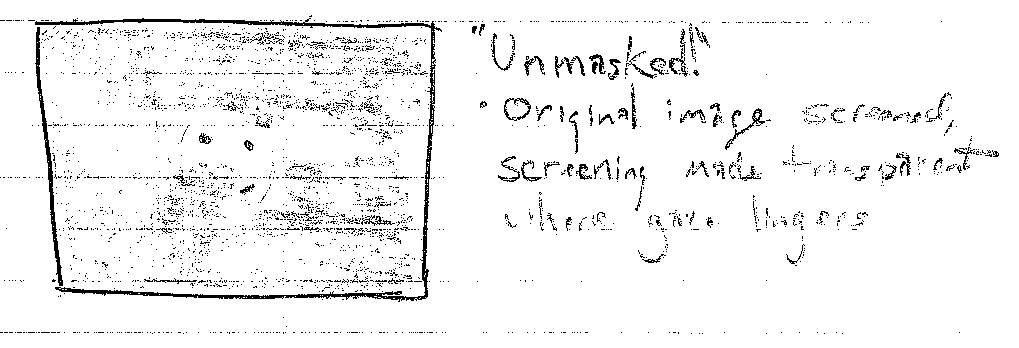
This will make the areas where there was the most activity the clearest. However, the areas there there was little activity will suffer from a loss of detail.
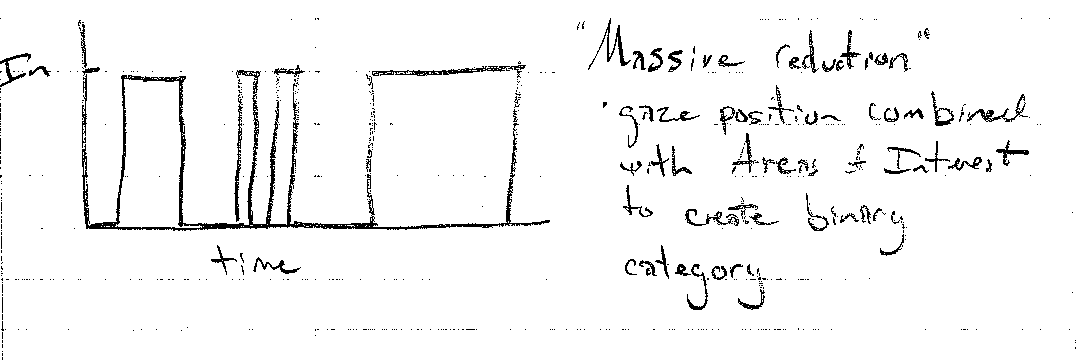
The last is to instead of aggregating position and time into “fixations”, we can collapse this into a binary category of whether or not the subject was looking inside the region of interest. Using the other axis as time produces a line graph that clearly shows when the subject was looking inside the area of interest. However, all context of where exactly the subject was looking will be lost. This encoding would be more useful if the image had more than one area of interest.