We are submitting the following visualizations:
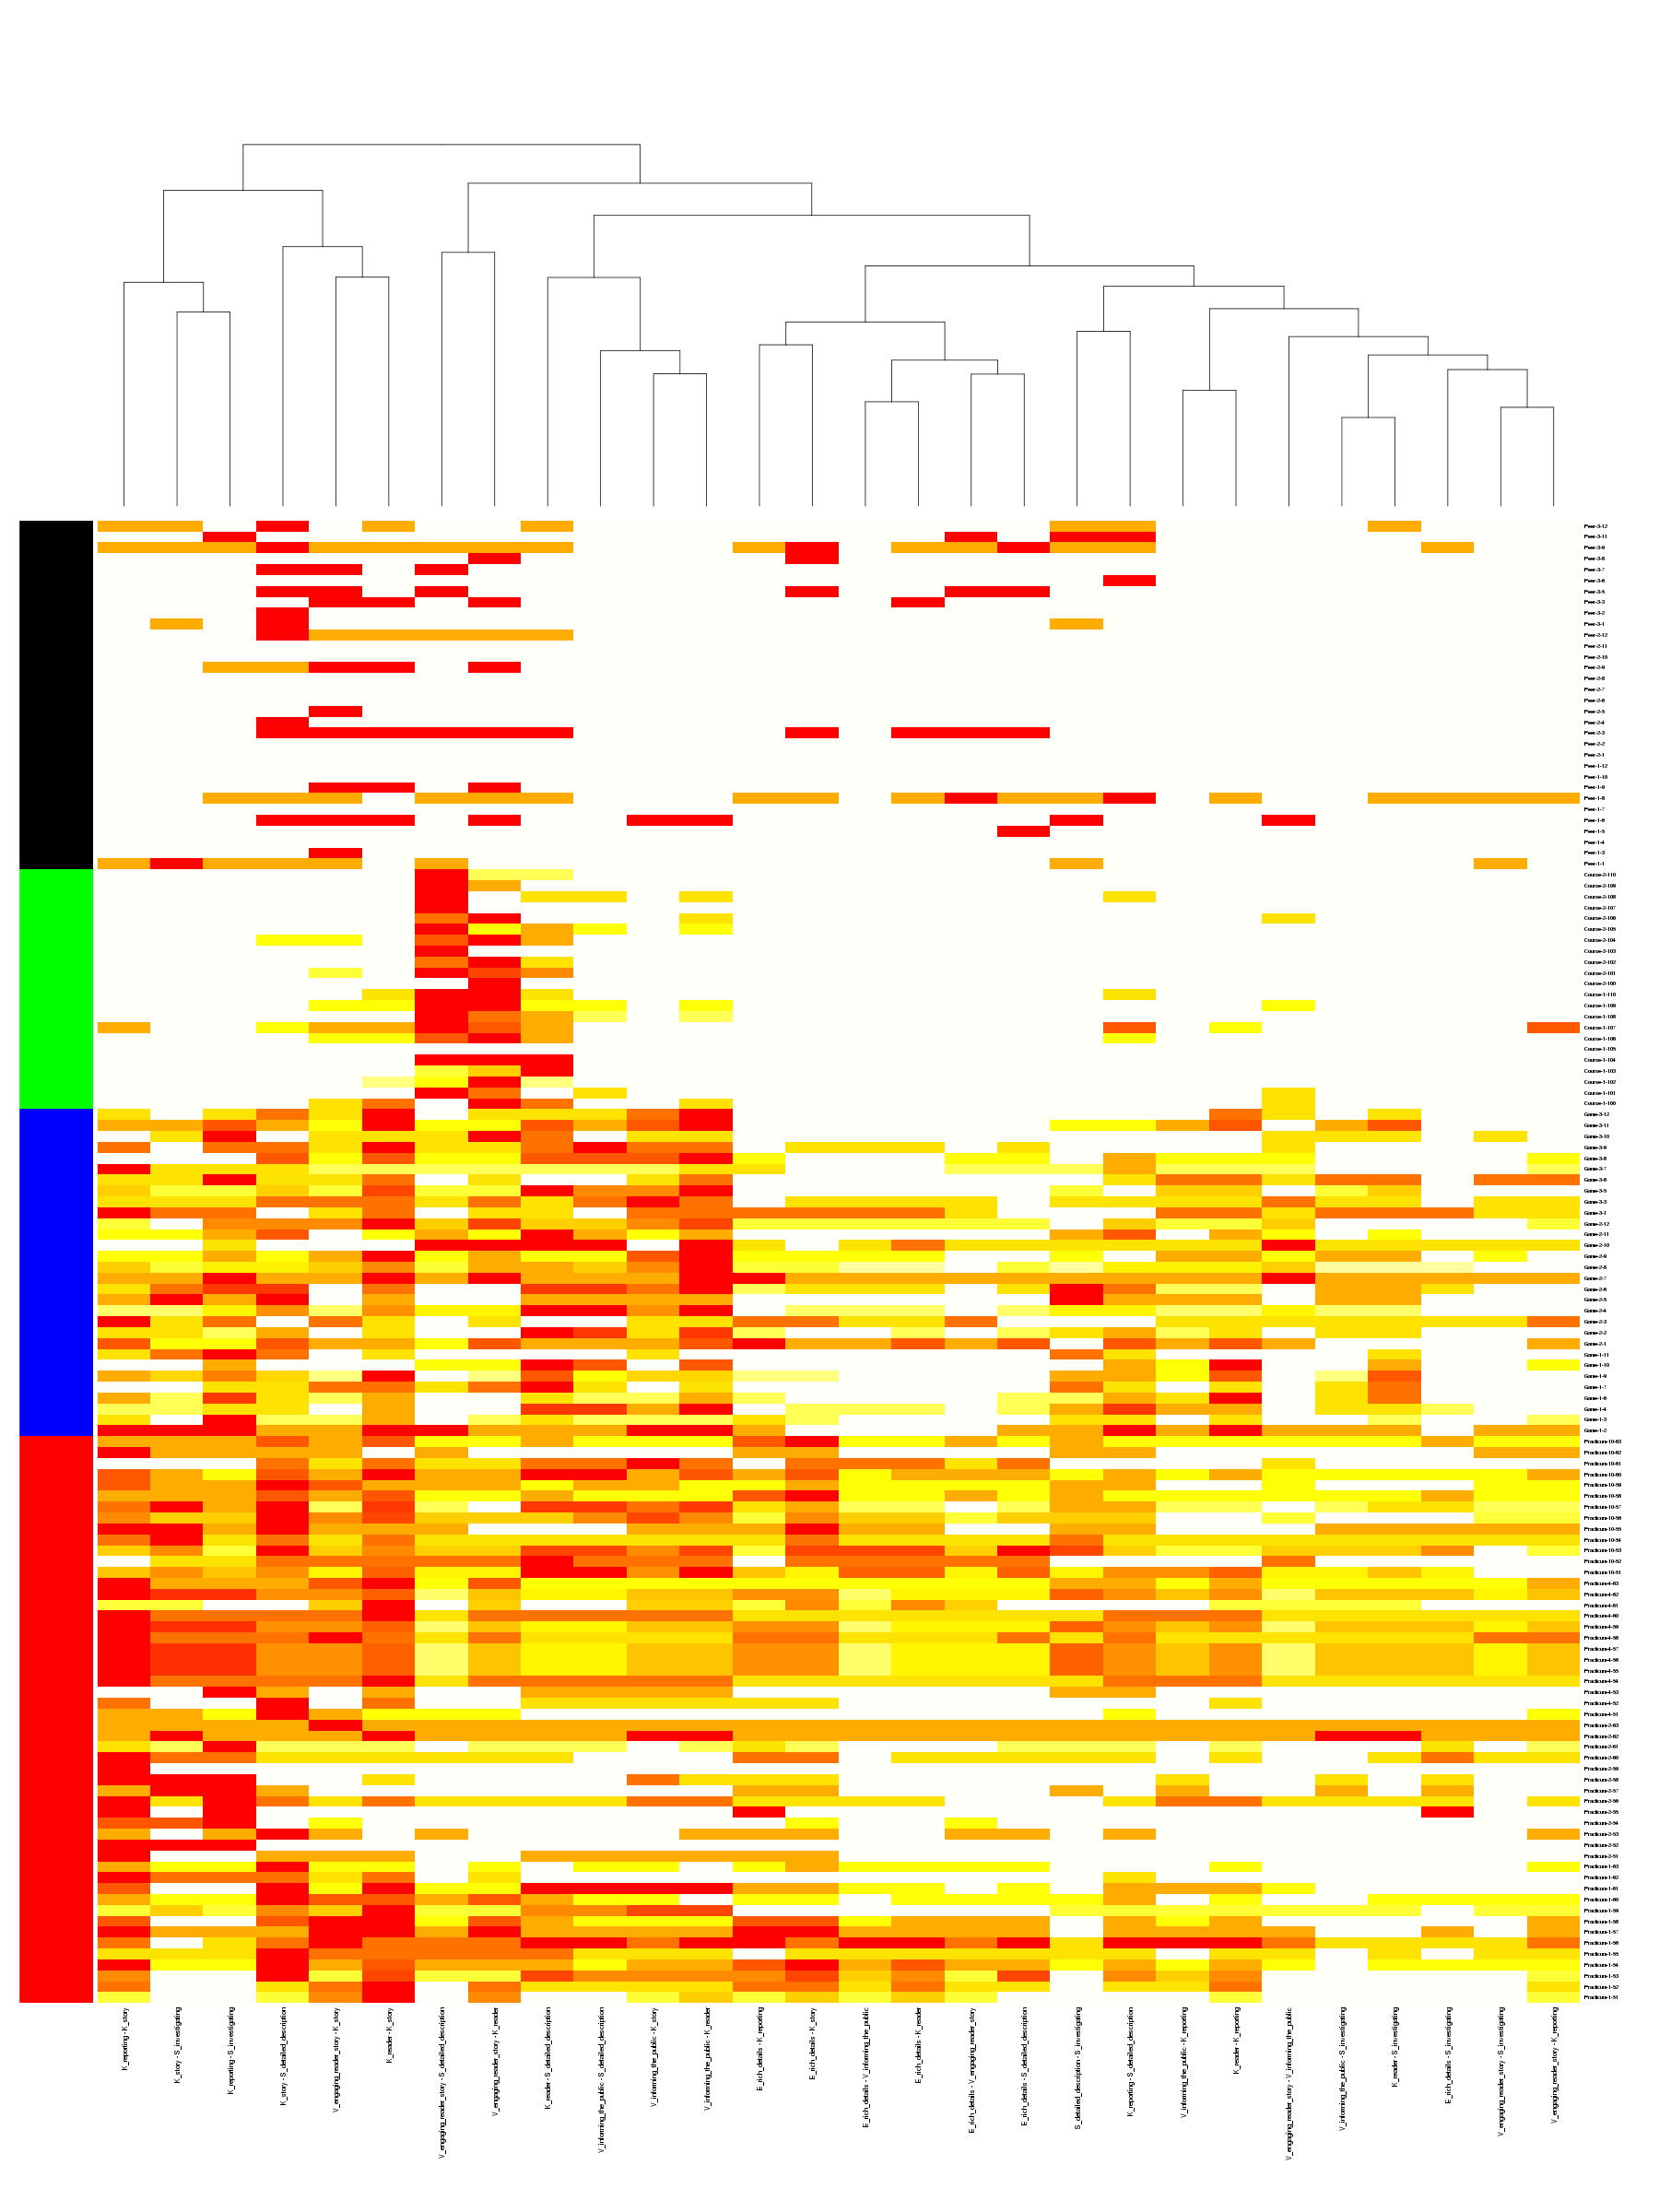
– A heat map created in R: Association strength is encoded by lightness of color. Each column corresponds to a pair. In other words, we transformed the upper triangle of the matrix into a vector. Each row corresponds to a participant in each venue. Here we presented all the participants’ vector because in this way we see the contrast among groups with possible noise/variance.
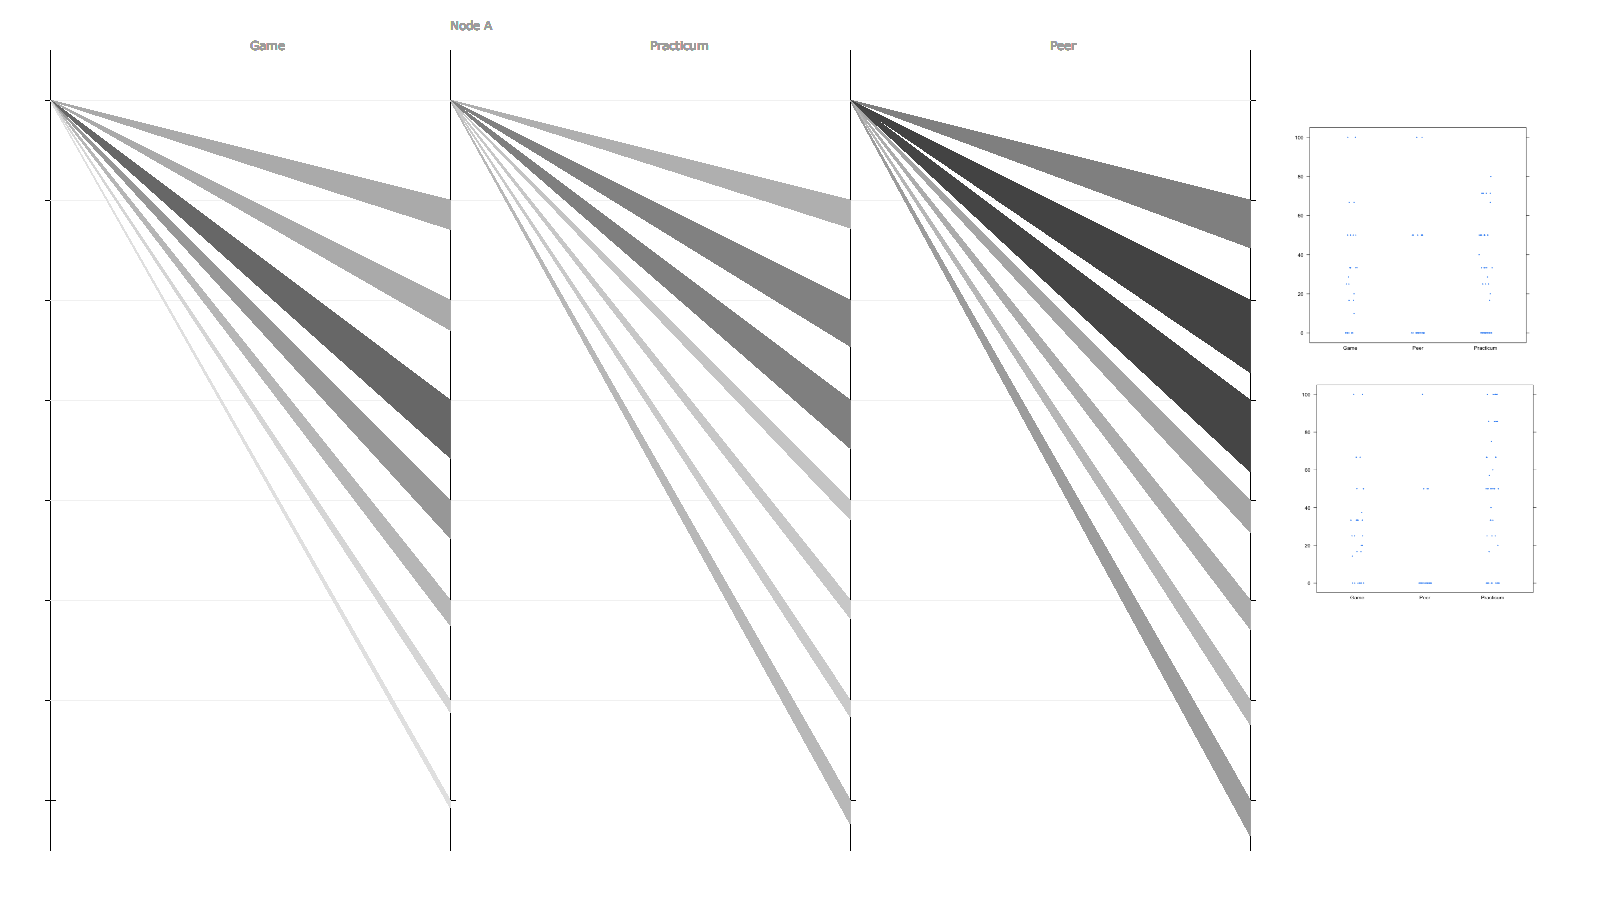
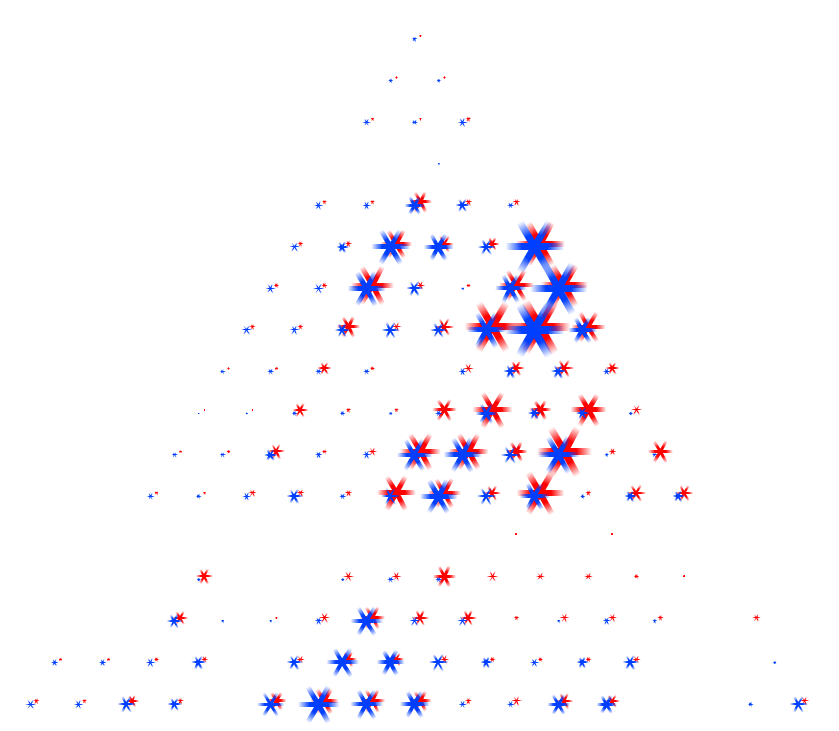
– A visualization made up of cascading triangles showing the comparison between each “story” in each of the venues: In the parallel axis, nodes are placed. For a fixed node A, the pairs are presented by linking the left and right parallel axis with the width proportional to the association strength. The same information in other network is presented in the same way linked to the next parallel axis.
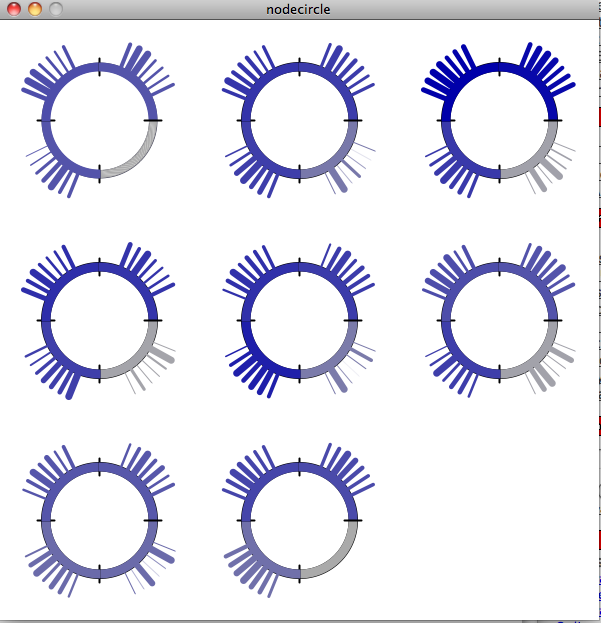
A node-circle visualization created in Processing: Each circle is a node and each sub-region in a circle represent a network. The coloring of these regions corresponds to normalized relative centrality values. The bars shows the connection strength of a node with all other nodes in corresponding network. The thickness of each bar shows the relative strength of the connection.
The same plot but using the length of the bar as encoding for node link strength.
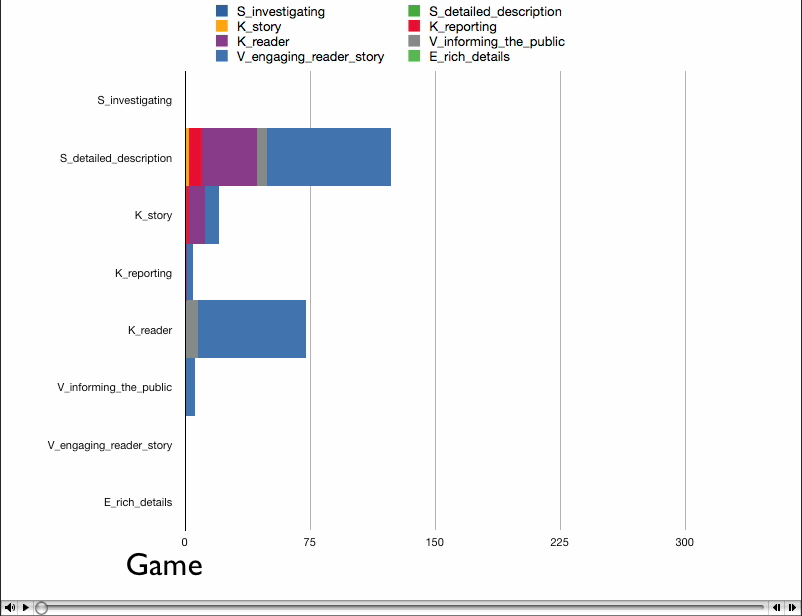
– An animated, horizontal stacked chart created in a spreadsheet software and Quicktime: Each scene is a “venue” showing each of the stories plotted against rest of the stories.
We created a visualization which uses human completion mechanisms instead of grouping mechanisms to show dense subsets of a matrix/graph.
{ 15 comments }
A few updated screen-shots for the node-circle (last one) visualization above:
1. The normalized node connection strength to other elements in each network represented using thickness of the bar as explained below. The updated part is that thickness now represents actual value instead of just random values as in the above post.
http://pages.cs.wisc.edu/~faisal/files/node_stroke.png
2. The same plot but using the length of the bar as encoding for node link strength.
http://pages.cs.wisc.edu/~faisal/files/node_length.png
I realized that the stacked chart animation is not showing up, and I can’t figure out how to embed a QuickTime movie in WordPress. It requires some JavaScript magic, and I can’t do that in WP.
Please click on the following link to see the animation. It should show up in all modern browsers.
http://www.cs.wisc.edu/graphics/Courses/Visualization10/wp-content/uploads/2010/03/stacked_charts.mov
We created a visualization which uses human completion mechanisms instead of grouping mechanisms to show dense subsets of a matrix/graph.
http://pages.cs.wisc.edu/~dhe/trix-01.png
For the first vis I think there should be definitely a way to reduce the dataload, since the purpose of the general view is to make patterns visible. maybe statistical clustering or filtering out high-relevancy relations could help. As for the nodecircle, spike widths don’t seem to make it easy to spot differences… maybe different encodings like color could be more effective.
I liked the visual simpleness of the stacked chart animation, and think it would be especially splendid for time-series datasets, since it is presented over time. For others, interactive browsing should be enough.
i was wondering about the dendogram in the first view – what does that tell me? can we compare dendograms?
The first design has too much bright colors, Perhaps combination of yellow and red is too strong. The difficulty with this visualization is that it require good amount of explanation before someone without knowledge can understand it.
The second design is simple, but some text will make it more understandable and in
this design, there is freedom to choose many colors. One problem that I see with this design is that when the dimension grow, the inclined line will come closer and it will be hard to differentiate.
The third design is simple, and it will provide more information if text is also used to convey the what each spike represent. May be different dimension can have different color. Overall it is a good design.
The fourth is simple and standard technique. The contrast in colors are nice. Display of legends convey useful information.
I like the first design. It doesn’t make much sense in the first view, but I can imagine that someone who has been looking at a lot of these or who has expertise or a trained eye could see multiple versions of this visualization and make out patterns. Yes, it requires explanation and may be a bit too busy, but once learned, it could be useful.
In the second design, it’s somewhat difficult to compare thickness of lines and darkness of the grey, especially when there is no overlap. It’s hard for me to look between all three an make any meaningful judgements.
The circles are nice and I think relatively comparable between them. It is taking and egocentric view, but looking across multiple data sets. I think labels are necessary, as I cannot tell if the specific skills are ordered in clockwise/counterclockwise fashion, or if they are mirrored symmetrically.
The progressing bar animation is an interesting way of showing change between data sets. It would be nice to just pause and switch through the different views instead of animating it, just so that we can focus on the data being seen.
The last visualization needs some explanation. I can somewhat compare between the two datasets, but it might be better to see two triangles side by side rather than overlapping.
I think that while the first visualization can provide a good overview of the data and show some patterns, it takes too long to understand it (at least for me), so it is better used as a snapshot view of the data.
The bar chart visualization is nice, but it is not easy to make comparisons between more than three matrices at once. Perhaps showing the others in a grayed out manner and switching contexts would help with this?
I like how the ring based visualization shows the centrality value with color, and the more fined grained data with length/thickness
The heatmap gives dendogram for the columns. I wonder whether it is the only categorizing solution given certain condition like maximum likelihood. The color is bright, but it might be the drawback of that software R, if I recall correctly.
Nodecircle visualizes all the required elements and is quite neat. If the spikes distribute equally along the circle, it will make it easy to view when there are more spikes.
The comparison between triangles tends to emphasize the upper parts. Maybe it is still better to keep using upper/lower triangles, which can help locating the original data.
The first graphic is a good candidate for some form of fisheye zoom. Since the bars of color are meant to show patterns, reducing the size of the bars to 6×6 pixels could be helpful in creating a uniform graphic of a smaller size. The ability to zoom in to particular areas would allow the user explore data that seemed interesting.
I like the circles for several reasons, but mostly because it creates a quick snapshot. I would probably reduce the size and thickness of the inner circles so that more ‘ink’ is given to the lines representing data.
The animation is helpful for making comparisons but it would probably be more useful as an interactive demo, so that comparisons could be made in a non-linear manner.
The heat map visualization does allow the user to explore trends in a lot of data. However, as mentioned before, it seems as if the tree-like structure on top does not convey much meaningful information and the labels on the chart are actually very difficult to read. Even though this view has been compressed, the fact that this text is small suggests that some data compression or text-size expansion may prove beneficial.
The second visualization is a very aesthetically pleasing view; however, I’m not really sure what the color encoding on the view represents. Since there is a discrepancy in color, it’d be nice if this was a data encoding.
The third visualization is very difficult to make comparisons between nodes, but the length encoding does go a long way to explain relationships within a node across networks.
The animated visualization provides a nice visualization in terms of manipulating the temporal dimension. It would be nice, however, if the user could have interactive control of the changes in time, it would be a lot easier to use the visualization in a more analytical sense.
The final visualization definitely utilizes pop-outs well; however without more detail with regard to what the visualization is actually showing, it’s really difficult to understand what it is showing.
If these, I thought the circle and density visualizations where the most interesting. The circle’s proved an interesting way to interpret the data.
The presentation seemed to imply that the density visualization failed, but I thought there was a lot of promise in it. It seemed like the idea almost correct and the visualization captured it perfectly.
The heat map does show a lot of data at the same time. However, it seems hard to handle large scale datas since it seems hard to extract information from this sea of pairs. I’m also confused by the black, red, green and blue section: what do them stand for?
The second visualization is more like an oblique bar chart. Since for oblique designs, there might be two sets of useful resources for coding: the oblique angle and the width of one edge of the trangle, some further modification might be worthy.
I like the third design very much. Though it basically concealed the relation ship between the whole matrices and between nodes and nodes, it compares each node value of different matrices very clearly.
The problem of the final design might be scalibility. Cluttering problems might be extremely serious with more matrices to compare with.
I agree with everyone else about the heat map: it’s interesting, shows a lot of information, but takes some time to understand, and it would be nice if the user could zoom in on specific parts.
The circles are a really neat idea. This visualization is clean, simple, and shows a lot of information. I prefer the length encoding over the thickness encoding. It’s easier to distinguish between lengths since the circles are so small.
I like the animation too, but I think it might be more effective if the bars actually shrunk and grew, instead of just crossfading from one configuration to the next.
Yup. I’m in with others on the heatmap — a promising idea that could use a little refinement. Interactivity might help a lot — or even making the individual elements somewhat smaller, and somewhat decreasing the intensity of the differences between the cells. Right now, I think my eyes are picking up more noise than is necessary.
The circle display is a super neat idea. The only thing that seems a little troubling is that adjacent sets of spokes visually look like they’re more related than those farther away — and as far as I can tell, that’s not true.
I really wish the triangle-star view worked better. The idea of tricking our eyes into completing lines is quite neat. However, I’m not entirely sure those patterns would mean a lot in the data — I think this transformation leaves some axes in places where you’d expect spatial correlations, and some axes in places where you wouldn’t, and it’s not apparent which is which.