# NetWork Performance Visualization
Sometimes, with visualization, we can enhance the quality of presentation and by doing so, we add value to the
product’s reliability and acceptance by peoples. Akamai is one of the leader in Networking technologies and they
show their network performance by simple visualization tools. Here is one snapshot. With this tool, we can
intuitively find out the performance of the network for large data transfer.
#2. Most of the time effective visualization make complex physics easy to understand.
Scientists sometimes have social obligations to make science popular and for humans the easiest way to grasp or understand certain concepts are with visual tools. I have picked up some nice illustrations from Scientific American that shows how beautiful pictures can summarize human knowledge in few pictures.
In common parlance we sometimes use words such as “black holes”, expanding universe etc for which scientists spend their entire life understand the deep mysteries of the nature. With some visualizations tools, we capture the imagination of young people to attract them toward science. All great scientists ( example Richard Feynman) were great teachers because they were able to present their ideas with simplified pictures or models.


{ 1 comment }
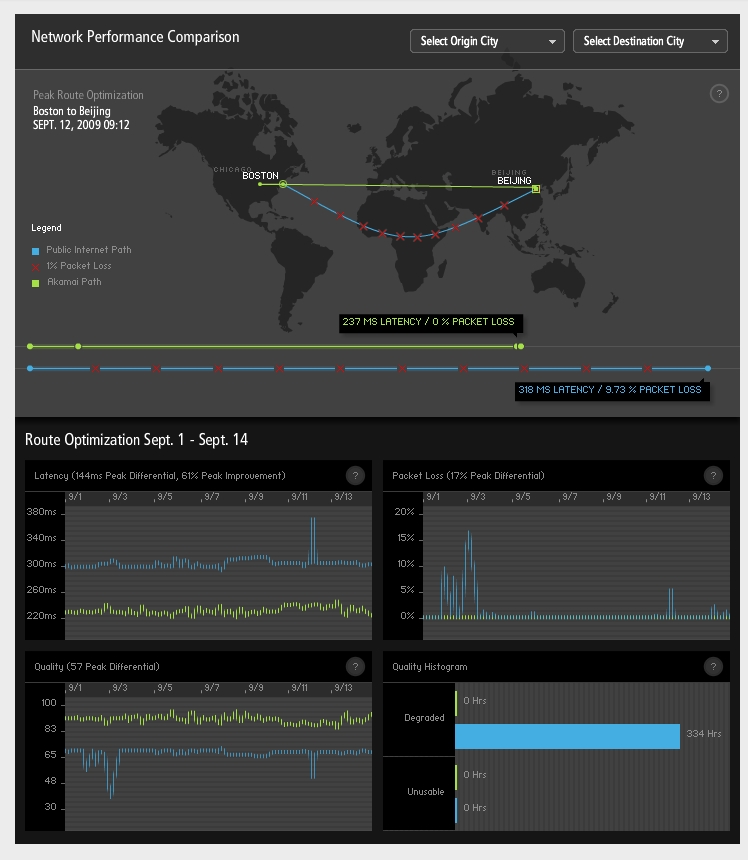
#1 Network performance
To show the network performance(problem), it looks at five different performance-related measurements in multiple views. It abstracts time, latency, packet loss, quality, routes between boston and beijing and distance. They encoded Akamai path with green and public path with blue for all the views. Juxtaposing two path’s performance measurements in each view clearly shows the better performance of Akamai path.
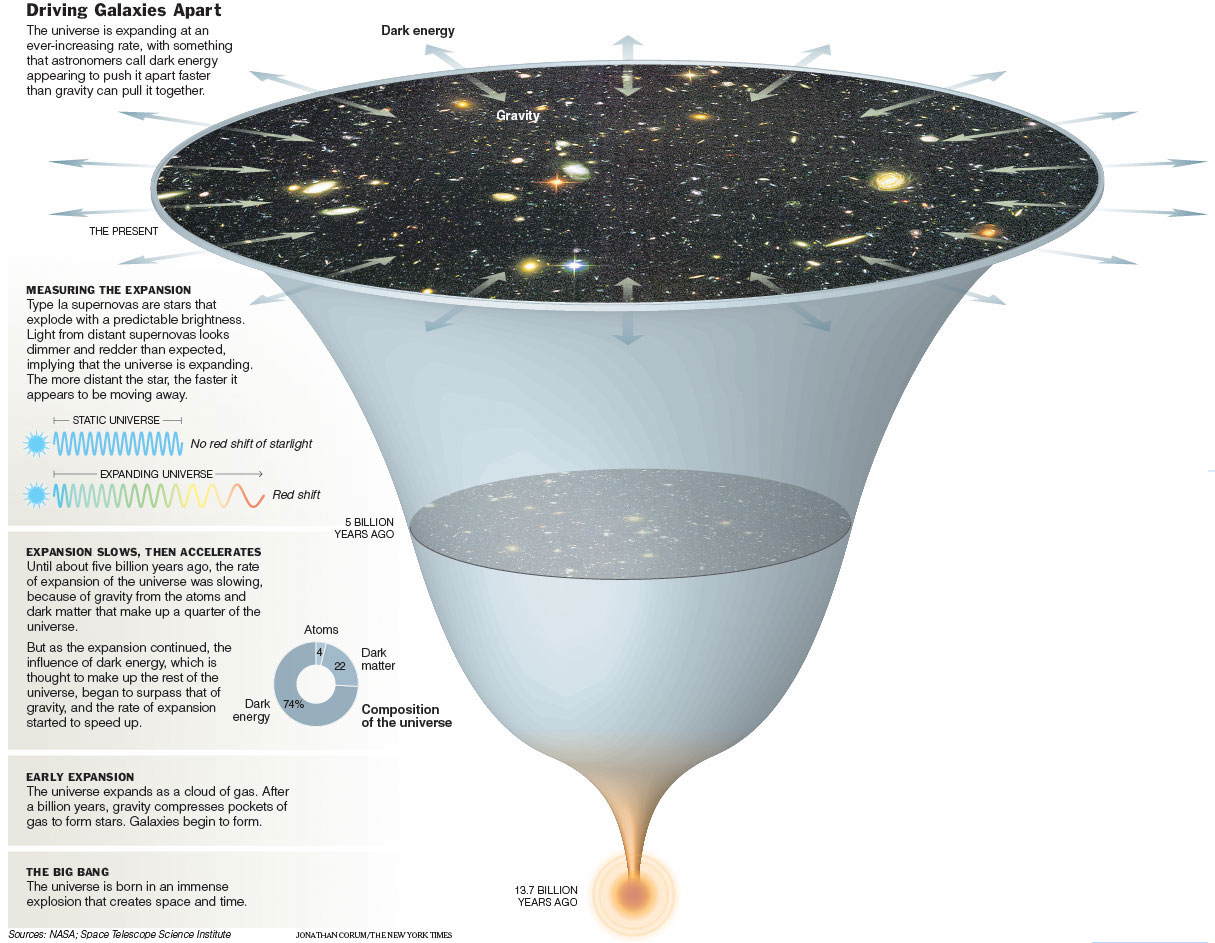
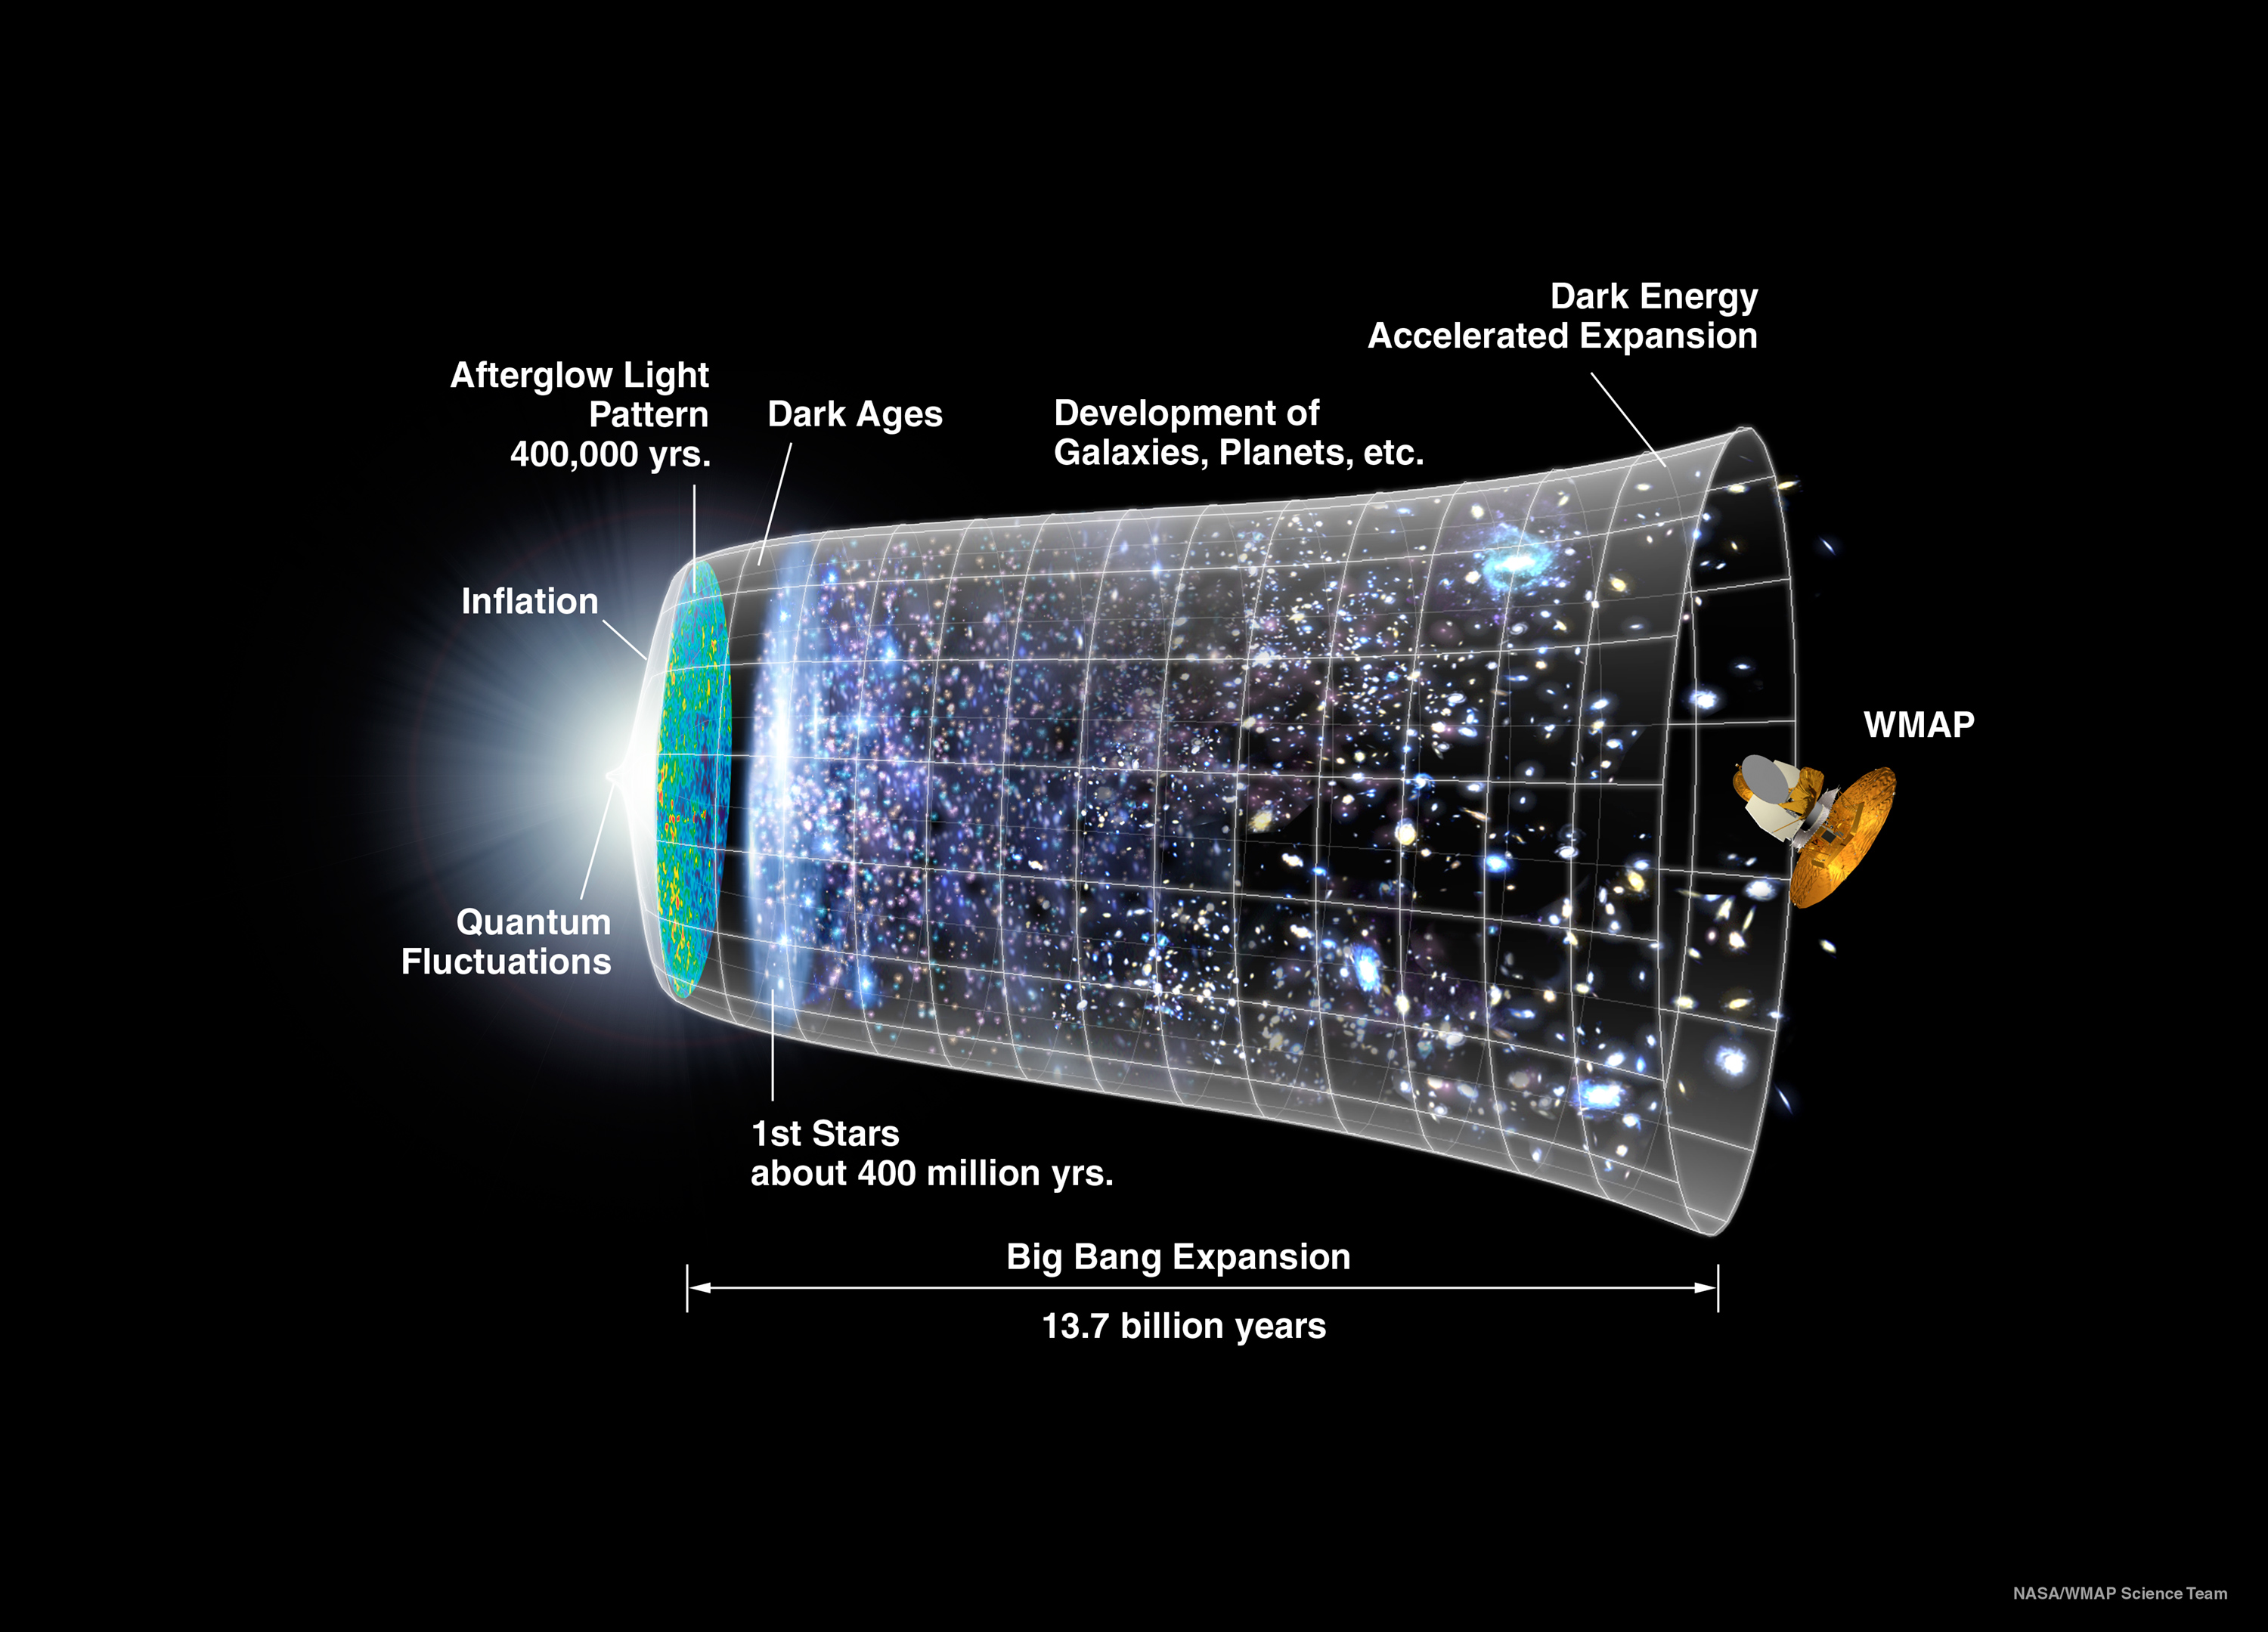
#2 Big-bang
It is a good explanation of how the universe evolved by showing the universe with its size and density of stars along with time.