Good

“Who is Paying Taxes” mint.
http://www.mint.com/blog/wp-content/uploads/2009/11/MINT-TAXES-R4.png
Found at: http://www.visualizingeconomics.com/
Critique
The chart above was found at the website cited above and a large version can be found by going there. This visualization falls on the InfoVis/Present side of the two perspectives covered in class and attempts to show the relation ship between income and income tax payed by different brackets of the population. The chart would be of interest to any member of the united states curious about who pays what percent of income tax. The chart contains both quantitative and ordered data. The quantitative data includes income size and percentage of taxable income. The ordered data includes income levels and percent income tax paid. I consider percent income tax paid to be ordered data because while the percentages could be considered quantitative, they are displayed in the context of a pie chart in which the size is used to create an ordering.
Tasks enabled include
- Determining what percentage of the population falls into a certain tax bracket.
- Determining what percentage of income in each tax bracket is considered taxable.
- Determining relative sizes of different tax brackets
- Determining how much total income tax is payed by each tax bracket.
Income size is encoded with plain text for each tax bracket. Percentage of taxable income is also encoded with text but also with a horizontal bar that is shaded with hash marks over the required percentage. Income levels are encoded using different shades of the color green with lighter being the lowest and higher being the darkest. The size of the tax brackets is encoded in the height of the green blocks as well as percentages to the size of the blocks. The percent income paid is encoded in a pie chart to the right of the income block along with text in each piece giving an exact value and shading that reflects the green counterpart. Connections are made between each income block and its percent of total income tax with lines that do not intersect.
Ordering of the tax brackets is done using both position and lightness. The highest earners are at the top and the lowest are at the bottom with the bottom being the lightest and the top being the darkest. According to Munzner, position is the best encoding for all data types, for ordered data, lightness is the second best encoding. The second best encoding for quantitative data is length which is used for percent of taxable income, and to some extent percent of income tax paid. Area is used extensively in both the table and the pie chart. While this is not one of the best encodings for any of the data types, it does allow the viewer to relate the sizes of two datum.
This visualization makes if very easy to answer the question “what percent of total tax income comes from what tax bracket.” It is clear that even though only 1.8% of the income of the highest tax bracket is taxable, that bracket still pays the majority of income tax collected. This is very important because saying that only 1.8% of income is taxable for those making more than $500,000 per year could be very misleading.
This is also a good example of removing chart junk. There are no tidbits of information cluttering the valuable information. There is a proper title and narrative at the top and a signature at the bottom. The rest is information relevant to the visualization.
Bad

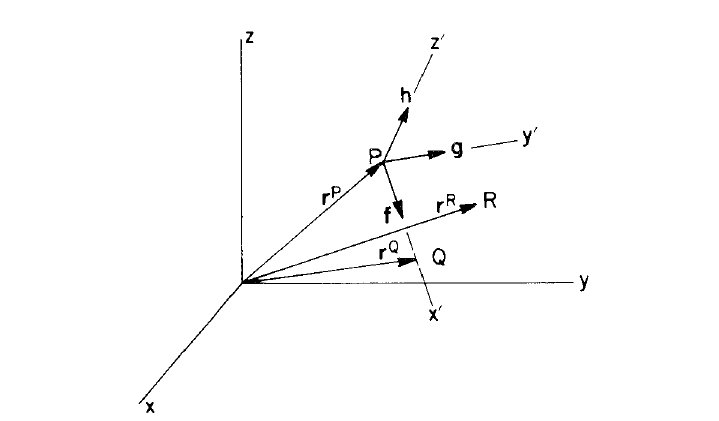
Edward J. Haug. Computer Aided Kinematics and Dynamics of Mechanical Systems. Allyn and Bacon 1989
Critique
Visualizations of three dimensional spaces occur in almost every graphics and vector-math text book. The image above is only an example of how this visualization is attempted. The example image is attempting to show a local reference frame inside of a global reference frame and depict points in each. This visualization method fails because often it doesn’t provide any method for determining “true” orientations. Often these visualizations are given as an afterthought to a larger more thorough narrative, however, even with a good explanation, the visual can be misleading. The main issues is that one entire dimension worth of data is thrown away in order to present the data in a two dimensional form.
There are a number of ambiguities including what direction is the x axis of the global reference frame pointing? Are z’ and x’ pointing towards or away from the viewer? Where is R? With a little information including knowledge of left or right handed conventions, these questions are a little easier to answer however there are a number of queues that could be added to help pull useful information from the image
{ 1 comment }
As for the tax visualization, it is indeed a clear presentation of comparing at least three important aspects (distribution of income classes, the taxable protion among each of them and the share they have in the tax income as a whole) in one diagram. Since the main purpose of the diagram is to see the differences between the class distribution and the tax share each class takes, I think the it would have been even clearer if the right part would have been the same format as the left one to show a parallel, instead of a pie chart.
For the 3-D graph, I agree that it’s hard to distinguish which plane the vectors are. Adding grids could lessen the confusion, but could make the visualization even more complex than it is already.