Maybe I wasn’t clear enough on Thursday that I wanted everyone to give me their project idea by Friday, but only a few people have.
So, for Tuesday, we’ll use the class time for me to meet with people to discuss the projects and help you get started. If this were better planned, we could have picked times so not everyone had to come for the whole time. But, if everyone comes, we can talk a little bit about administration at the beginning, and people who might want to join groups can talk to each other.
I will update the project page that has the deadlines and give some more instructions about what to do for your “plan” soon.
Daily weather data are collected at ground stations and sampled to a 1 sq. km. for the entire United States. The data are made available in a scientific format called NetCDF, which is essentially a hierarchical format capable of storing an arbitrary number of nested arrays. While suitable for storage and targeted analysis, NetCDF is not easily amenable to spatial query and visualization.
This is a proposal to convert the NetCDF format to a spatial database format, and then write routines and build the interface that would allow spatial selection of weather data and display them on a map as geo-referenced image.
The project would focus on creating a web-based working prototype for a specific part of the country. The prototype would be scalable to the entire country.
Plus: I already have the data; the spatial routines are pretty well established; the scientific contribution factor is high.
Minus: There is not much “new” in this proposal even though the innovation quotient in terms of improving a process is pretty high.
I made a posting on how we’ll do grading and evaluation for this class here. (I want to keep long posts off the news page)
You are all probably frustrated by the lack of feedback I’ve been providing. I apologize. Giving feedback to this class has been on my todo list (I realize lack of feedback is a problem), but things keep getting in the way.
Ideally, you should be doing this since you want to learn the material, but I understand that marks on your transcript are meaningful to some of you (the idea of grades in a graduate class is still wierd to me).
Your grade for this class will be a combination of:
- A big break for putting up with the experimental nature of this class.
- Do you show up? (I’ll be arrogant enough to believe that you’ll learn something by just being there)
- Do you contribute in lectures? (alternatively, do you contribute in other ways, like making posts, or sending lecture summaries – since I understand not everyone is comfortable contributing directly.
- Do you do the required minor assignments (e.g. do you make posts, …) – this is just counting?
- Are your minor assignments any good? (do you just make minimal posts on the readings, or do you routinely have something interesting to say)
- The major assignments (design challenge, critiques)
- The final project.
Some of those things are quantitative. But, others are highly subjective.
Michael and I tried an experiment to quantify participation, but it basically confirms our subjective experience.
Here is how I propose to give out grades (to those of you who get grades):
- 25% of the grade is for putting up with me (so everyone gets an A on this part).
- 25 % for the project (it’s 1/3 of the time of the class (5 weeks), but it’s not everything in that part).
- 1/6 for the major assignments (they took up 5 weeks (1/3), and were 1/2 of what you were doing at that time).
- 2/6=1/3 for the actual class part (2-5 above).
This week I will send you feedback on everything before break:
- An assessment of your “major assignments”
- The quantitative information we’ve gathered (how often do you show up, how many of the required minor assignments have you done)
- Subjective assessment of your postings and participation (with the quantitative attempt as well).
For the subjective participation part, I expect to categorize people as:
- Adequate/good/excellent – regularly contributes to the discussion or makes extra postings / sends summaries of lectures, etc.
- Inadequate to Adequate – occassionally contributes to the discussion, rarely adds anything extra
- Unacceptable to Inadequate – pretty much only contributes when called upon.
As its too hard to subjectively put things into finer divisions. You can probably guess which category I think you’re in.
A description of the final project has been posted here. Its long, so I didn’t put it in the news.
Short version: start thinking about what you want to do, and we’ll work together to develop it into a project plan.
(updated 4/13/2010)
There are merely 5 weeks left in the semester (the downside of having break left). And I need to figure out how to have a project for a pretty diverse set of students.
There are 3 different kinds of projects. If there were more time, we would do all three:
- Design – take a particular data set, and create a visualization of it. Doing this involves understanding the design choices in making an effective visualization. It may require a non-trivial amount of “data scraping” to gather the necessary data and get it into the form you need to make the visualization. Note: if you choose a design focused project, you will need to provide some discussion to let us know that there is enough “real work” involved.
- Implementation / Methodology – create a tool for visualizing a type of data, preferably by exploring the use of a particular method (or developing a new method). Such a project might try to develop a new technical method, or integrate a known method in a new way.
- Survey – read several papers about a topic, to create a summary of what is already known. A good survey doesn’t just summarize the papers: it also provides some value in describing their relationship (for example, how to choose amongst the methods surveyed, or describing how a set of ideas might be applied).
Note: that any project is likely to be a mix of all 3. Even if you are doing a design, you’ll want to look at the existing literature (survey), and there might be some implementation involved (for example to make an interactive tool for exploring the data set).
For this class, your project must have some aspect of all 3. You can choose one or two areas to focus on (for example, you might focus on design, in which case we’ll expect a lot of work in the design area, but at least some survey (reading) and implementation.
You may choose
For your project, you can pick (if you don’t pick, we’ll pick for you):
- The topic. You might center your project around a particular data set you are interested in, a particular technique that you want to read a lot about, an idea for a method that you might want to explore.
- The focus. You might focus on design, implementation/methodolgy, or survey. Note: that you still must do some of the other 2.
For any project you must:
- Do enough reading. For any project, you must read at least 5 things and write summaries of them. Based on your topic, I will give you 1 or 2 to start, but its your job to find more. You should make a list of things that you should have read (if you had more time) as well, and pick the most important things from that list. If your project is survey focused, you should read at least 10 things, and have your writeup “add value” to the combined summary (as described above under Survey).
- Create a visualization of a particular data set. If your project is implementation, you should show it off on some example data. If your project is survey, you should create some visualization that illustrates what you’ve learned. (in these cases, the visualization might be a static picture). If your project is design focused, you need to create some well thought out visualization that actually solves the problems of some real data set, and have your writeup discuss the demands of the problems, how your solution addresses it, as well as some discussion of the design space (what alternatives did you consider that were not as good, compare your choices with other things you could have done, …)
- Create a writeup: your writeup must be in the format of a
Eurovis poster paper IEEE Visualization poster paper and 4 pages, not 2 pages. The writeup must be submitted as PDF document. The format is described here, including Word and LaTeX templates. Note: you do not need to provide the “Descriptors” or “Keywords.”
- Give a final presentation: the exact format of this is to be determined. But you might be expected to give a 10-15 minute presentation to the class, or we might have a poster session, or …
- Submit all artifacts (programs, paper summaries, design documents, …)
- Submit regular progress reports. Your grade grade will be determined not only by the final product, but also the documentation you create along the way (like submitting plans and progress reports along the way).
Some deadlines:
- Wednesday, April 7th, noon: email the instructor and the TA with your topic, and some idea of what you are going to do. The unusual (Wednesday) deadline will give us some time to think about your project so we can help you develop a plan, and hopefully suggest some things to start reading. If you haven’t picked something specific, send us some rough ideas so we can help you pick something. If you don’t pick something by this deadline, we will pick something for you. If you are planning to work with a partner, please indicate that in the email.
- Thursday, April 8th, class: Project kickoff. We’ll use the class to have a discussion of project topics. We will either have some 1-on-1 discussions, or schedule some for each project. In this time slot, we’ll hopefully transform rough ideas submitted by email into more fleshed out project ideas.
- Friday, April 16th:
Wednesday, April 14th:Project plan. You must send a project plan (by email to the instructor and TA) you must post a project plan to the course web. Details are posted here. You may be asked to revise the plan based on our feedback of the initial version.
- Friday, April 23rd: Progress report: You must email the TA and instructor with a description of what you’ve done so far. You must send at least 2 paper summaries, and hopefully some initial results.
- Friday, April 30th: Progress report: This progress report should include a list of the papers (but not the actual summaries) you’ve read, a description of what you have done so far, some initial images, and a description of what you expect to have at the final deadline.
- Thursday, May 6th: 11am (e.g. before the last class): everything due (final writeups, all “artifacts”, etc). Extensions until the exam week are available by specific request.
The idea is that you’ll spend the first week trying to define a project idea, and developing a plan. We will work with you to do this.
Some ideas or sources of ideas:
- I have created a blog category called “project ideas” that I will post project ideas. Some of the things listed will be there.
- The Design for America challenge is a great source of ideas.
- The Visual Analytics Benchmark Repository has a number of data sets with example problems to try. Some of these were given as content challenge problems.
- You could try your hand at the 2010 VAST challenge. We could even consider assembling a team to compete in the contest.
- You can look at the projects done in the Harvard CS171 class for inspiration.
- The Visualization conference posters are a good source of ideas for small projects (since many of them are student/class projects). I will make the poster papers available to the class.
- You can pick an interesting visualization tool and try to learn about it and give an example of how its used. For example, there is a public version of Tableau. Or you might try building something with a toolkit like protovis, flare, or prefuse.
- You can pick a topic we aren’t going to cover enough in class: you might learn about (and implement) some graph layout algorithms, learn about the variety of approaches for doing focus+context interactions, …
- You could explore the depiction of uncertainty and error in visualization, and try to develop ways to show uncertainty (statistical properties) in different kinds of visualizations. (e.g.: error bars are easy to add to a bar chart, but how do you use it to show the variance on a graph or a volume visualization).
- You could try to find ways to use optimization to choose sets of colors that are perceptually distinct, but also follow proper “color harmonies” (these can actually be defined mathematically).
- You could define and run some perceptual experiments to understand how effective different methods are.
- You could take some hard data set that we have access to. We have long time-series of accelerometers and foot switches tied to walking, molecular shape data, try to display large-scale protein sequence matching computations, …
- Personal multi-media collections are a particularly ripe topic for visualization, requiring a mix of design and implementation methodology. How can I keep track of my large collection of pictures? How can I figure out which of the pictures on my disk I’ve already uploaded to Flickr? How can I keep track that there are multiple versions (one picture is a cropped version of another, or is just a different file format)? You can try to take on the multi-media problem of figuring out the equivalences, or just assume that you get the answers from some place.
- You could think about/develop collaborative tools (either for online communities, or small groups to work together) for other vis problems (even if the problems are well-solved for a single person).
- You could flip through the Vis proceedings and find papers that describe interesting techniques that you might want to try. (often the techniques in papers are much easier to reproduce than to develop in the first place)
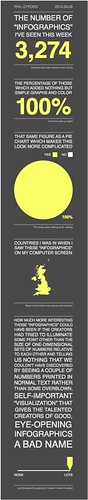
An infographic website companion to the radio show “This American Life.”
http://tai.ejfox.com/
Hard to believe there are only 5 weeks left!
This week we’ll learn about 3D perception, and get started on projects. Information on the projects is posted.
- Tuesday, April 6 – We’ll talk about 3D perception (or, the perception of 3D shape, to be more precise). There is a reading that you need to comment on.
- Wednesday, April 7 – You will need to send email with the rough idea for your project (instructions in the project post). It is important that you do this so the instructor can help you narrow things down (and discuss it in class). If you don’t pick a project, we will pick one for you.
- Thursday, April 8 – We’ll talk about projects. Hopefully, this will relate to what everyone wants to work on. Or maybe I’ll use it as a time to discuss some of my projects.
(due Tuesday, April 6th)
For this lecture, we’ll move on to the third dimension. While it is very tempting to suggest we read something on the various artistic techniques or things used in visualization, we’ll start with the perceptual foundations. If you’re interested in lighting or shading or … it can make a great project.
- James Todd. The Visual Perception of 3D Shape. Trends in Cognitive Science. 2004. A nice, compact article.
- Chapter 5 of Ware’s Visual Thinking for Design. This actually discusses a lot more than just 3D perception.
As usual, post (at least one) comment about the readings.