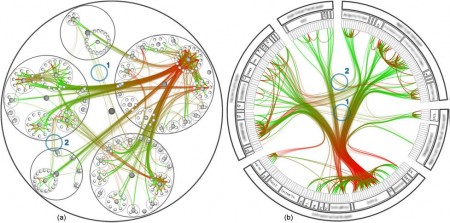
One of the better visualizations that I’ve come across is in the Hierarchical Edge Bundles system built by Danny Holten at the University of Eindhoven. In this system, the visualizations are derived from a set of hierarchical data. The data is then drawn into clusters using either a radial or balloon layout. Finally, the relationships between the different data points is drawn by the use of edges linking the different points. These edges form a color gradient from the parent(green) to the child(red) and are further clustered with like edges through a series of bundling operations defined by a bundling parameter beta.
This visualization allows for a cleaner view of the relationships amongst hierarchical data. By encoding the edge direction via color and creating edge bundles of varying strengths, the user can easily detect patterns across the hierarchy of data and begin to form a more clustered hierarchy. By presenting this data in a radial or balloon layout, more information can also be derived in a single viewpoint than can be done with a simple top-down tree layout. In general, this represents a very clean design and uses encodings that are clear and easy to read. Data does not seem to become foggy as a result of the techiques and relationships within the data are very clearly emphasized.
In general, I really like this visualization because it is very clean and applicable to any sort of hierarchically defined data. Aesthetically, it makes for a very nice visual and also clearly conveys its intended information. More pictures and the paper explaining the system can be found here.

{ 1 comment }
I have a mixed reaction to this visualization. Like Danielle, I agree that hierarchical edge bundling vis described in the paper produces pleasing images, and also shows hierarchy between the connected nodes via the use of colors in a compact space. I am not too sure of how easy it is to understand the resulting visualization in a static image. If this technique were employed in a software, such as was for the Synteny Gene Browser, I can imagine it would be very useful. However, the density of information in a static image is only good for a large scale (coarse, high level) view, with no resolution for small scale viewing.