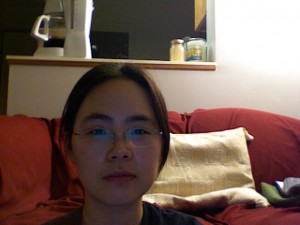
I’m a fifth year statistics PhD student. My interest is in understanding the overall relation of genotypes and mRNA expression with additional information.
I see myself as a domain scientist neither designer nor visual scientist. If I have a data, I would draw a plot first to get a sense of the data, try statistical test/modeling inferred from the plot and then explain what the plot means and the statistical test means. I want to learn better ways to convey information in a visual way because I think most of time a plot is powerful (quick and easy) than a paragraph.
I can do R, python and a little bit of C. All my design skill is basically to draw a scatterplot in 2-D using R.
