DC2 Sample Data
(update 11/10/2018 – some students pointed out that the 2017 sample data has 4 groups not 5)
For each example data set there is a JSON, a CSV, and an SVG of each of the example designs (see DC2 Example Designs). These visualizations are VERY simple.
The simple synthetic graphs are good for testing things out – especially if you are trying to show graph structure.
The 2017 data is good for testing since its realistic. But its a bit boring.
The data is in http://graphics.cs.wisc.edu/Vis/CS765-2018-DC2-ExampleData/
Simple Single Synthetic Graphs
These aren’t realistic – but they are graphs of various sizes and patterns so you can test things. The times, users, and other features are assigned in a valid, but non-interesting manner. The main thing here is the tree structure.
For randomly generated things, there are a few of each, since each time, a different tree gets generated each time.
There are no swarmplots for these.
- Regular Trees (small testing examples)
- Binary Depth 3 00-binary-3-0 (json) (csv) (tree svg) (15 nodes)
- Binary Depth 5 01-binary-5-0 (json) (csv) (tree svg) (63 nodes)
- Binary Depth 8 02-binary-8-0 (json) (csv) (tree svg) (511 nodes)
- Trinary Depth 3 03-trinary-3-0 (json) (csv) (tree svg) (40 nodes)
- Trinary Depth 5 04-trinary-5-0 (json) (csv) (tree svg) (364 nodes)
- Trinary Depth 8 05-trinary-8-0 (json) (csv) (tree svg) (9841 nodes)
- 4-way tree Depth 3 06-4-way-3-0 (json) (csv) (tree svg) (85 nodes)
- 4-way tree Depth 5 07-4-way-5-0 (json) (csv) (tree svg) (1365 nodes)
- Carved Out Binary Trees – These are like the binary trees, but randomly, things can have [0,1,2]
- Depth 5
- 08-carved-binary-5-0 (json) (csv) (tree svg) (15 nodes)
- 08-carved-binary-5-1 (json) (csv) (tree svg) (8 nodes)
- 08-carved-binary-5-2 (json) (csv) (tree svg) (19 nodes)
- Depth 8
- 09-carved-binary-8-0 (json) (csv) (tree svg) (17 nodes)
- 09-carved-binary-8-1 (json) (csv) (tree svg) (19 nodes)
- 09-carved-binary-8-2 (json) (csv) (tree svg) (35 nodes)
- Depth 5
- Carved Out Trinary Trees
- Depth 5
- 00-carved-trinary-5-0 (json) (csv) (tree svg) (53 nodes)
- 00-carved-trinary-5-1 (json) (csv) (tree svg) (70 nodes)
- 00-carved-trinary-5-2 (json) (csv) (tree svg) (87 nodes)
- Depth 8
- 11-carved-trinary-8-0 (json) (csv) (tree svg) (172 nodes)
- 11-carved-trinary-8-1 (json) (csv) (tree svg) (602 nodes)
- 11-carved-trinary-8-2 (json) (csv) (tree svg) (98 nodes)
- Depth 5
- Bigger trees
- Up to 6 branches, Up to depth 8, Things thin out
- 12-medium-8-0 (json) (csv) (tree svg) (275 nodes)
- 12-medium-8-1 (json) (csv) (tree svg) (341 nodes)
- 12-medium-8-2 (json) (csv) (tree svg) (316 nodes)
- Up to 6 branches, up to depth 12, things thin out
- 13-medium-12-0 (json) (csv) (tree svg) (72 nodes)
- 13-medium-12-1 (json) (csv) (tree svg) (186 nodes)
- 13-medium-12-2 (json) (csv) (tree svg) (46 nodes)
- Up to 6 branches, up to depth 20, things thin out
- 14-medium-20-0 (json) (csv) (tree svg) (428 nodes)
- 14-medium-20-1 (json) (csv) (tree svg) (263 nodes)
- 14-medium-20-2 (json) (csv) (tree svg) (260 nodes)
- Up to 6 branches, Up to depth 8, Things thin out
Data from Actual Assignments
These are from prior years assignments. The structure of the class was similar, but the assignments were not the same. Same basic idea (make an initial post and converse), but the timing was different, and there were oddities like requiring two initial postings on some assignments.
All the user IDs and assignment IDs have been changed, as have the times and dates. There was some randomness added to the message lengths as well.
This data is kindof boring – there wasn’t that much discussion.
- A Single Group, A single assignment
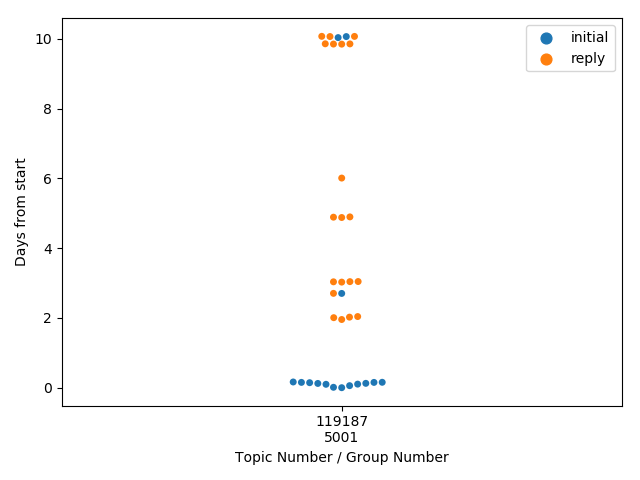
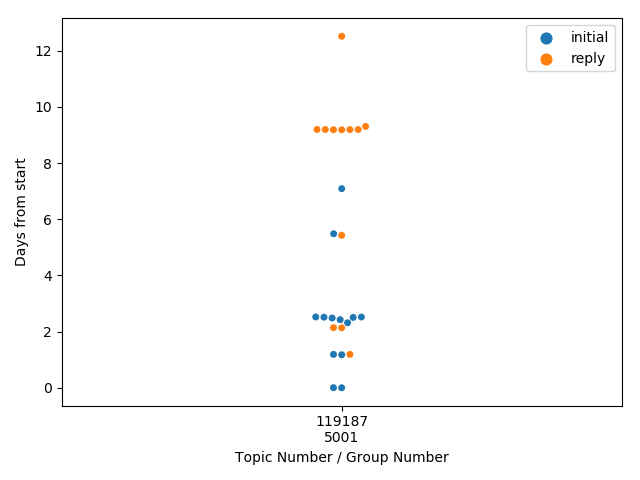
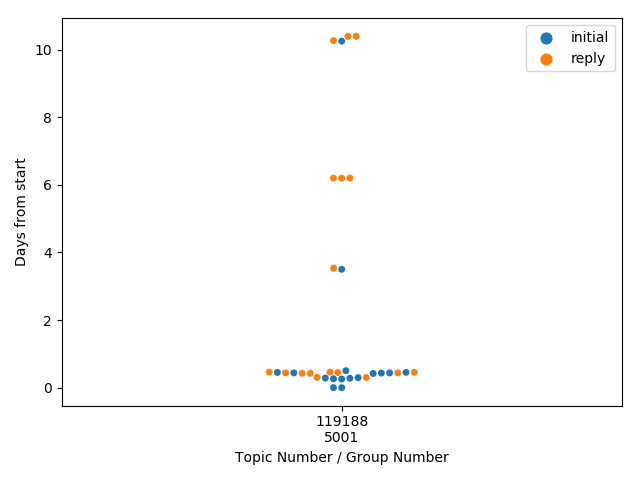
- 2017-1-1-1 (json) (csv) (tree svg) (swarm) (35 nodes)
- 2017-1-1-2 (json) (csv) (tree svg) (swarm) (25 nodes)
- 2017-1-1-3 (json) (csv) (tree svg) (swarm) (33 nodes)
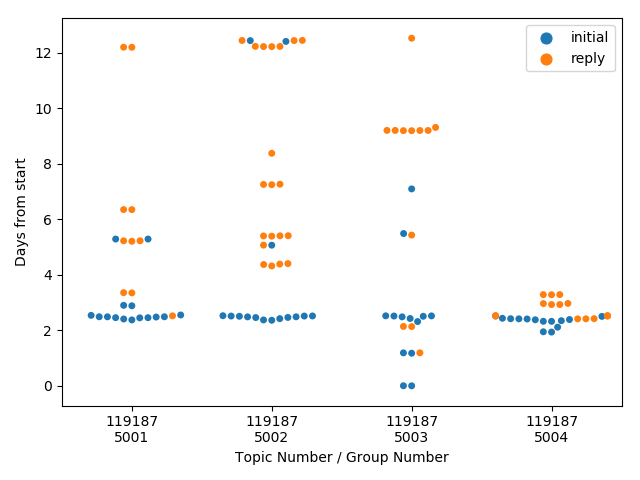
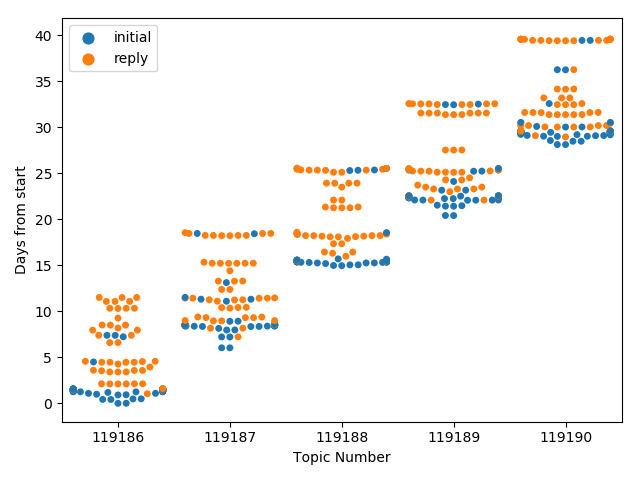
- One Assignment, 4 groups 2017-1-5 (json) (csv) (tree svg) (swarm) (114 nodes)
- One Group, 5 assignments 2017-5-1 (json) (csv) (tree svg) (swarm)
- Four Groups, Five Assignments 2017-5-5 (json) (csv) (tree svg) (swarm) (584 nodes)