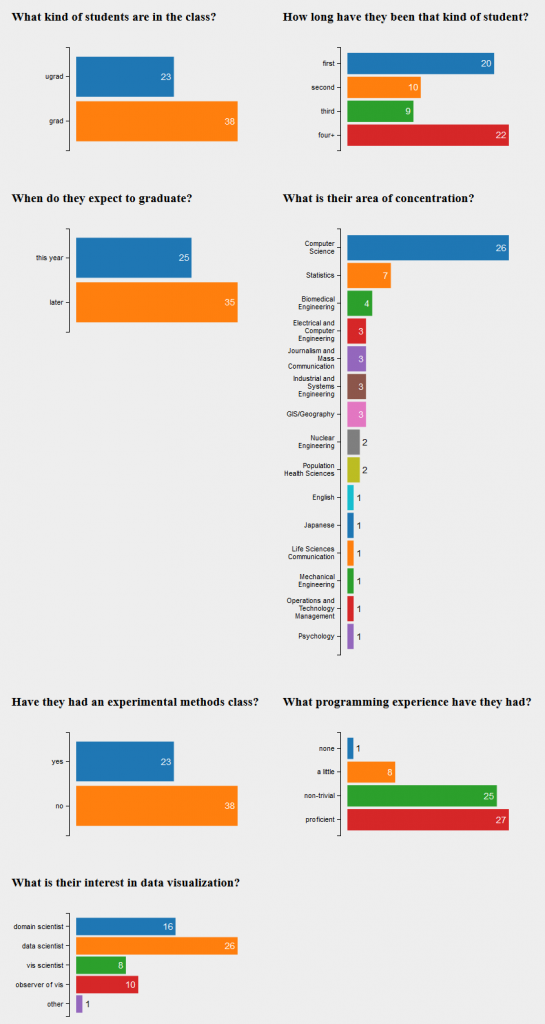
Here (finally) are the survey results:
You can see the full visualization here. Click the ‘view in new window’ link to see the whole visualization. bl.ocks.org is a convenient website to see D3 snippets and see how they work.
In terms of student makeup, we have 23 undergrads (38%) and 38 graduate students (62%). Of the undergrads, 3are sophomores, 5 are juniors, and 15 are seniors. For the graduate students, 20 are first-year, 7 are second-year, 4 are third-year, and 7 are more senior than that (4+).

