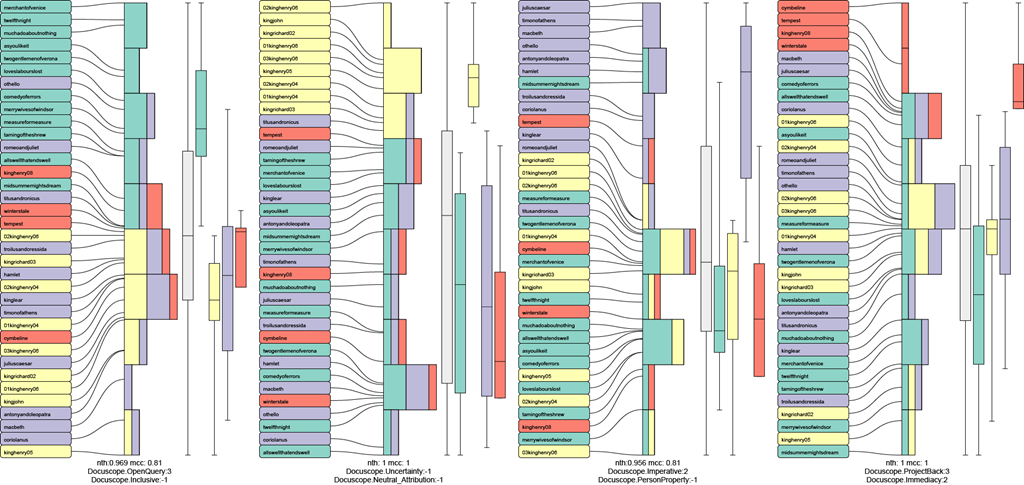
The Explainers effort is trying to develop methods that help people build understanding of high dimensional data sets. We attempt to find models of the data that are easy to comprehend, and more likely to lead the viewer to develop theories or understanding. This involves exploring tradeoffs between the typical machine learning and statistics goals for models (accurately and efficiently representing data, or making predictions from it) and other properties that make the models more usable by people (e.g. simplicity, familiarity, parsimony).
The initial paper considers trying to create simple “explanations” of binary concepts (like “Comedic-ness” or “like-Paris-ness”) in terms of high dimensional data. It adapts machine learning classification techniques to account for tradeoffs between various types of performance and understandability :
Michael Gleicher. Explainers: Expert Explorations with Crafted Projections. IEEE Transactions on Visualization and Computer Graphics, 19 (12) 2042-2051. Proceeding VAST 2013. (link) (doi) (Best paper honorable mention)
The supplementary material from the paper is a good place to look at examples (much better than the paper). In fact, the simplest example (Figure 0) is probably the best place to start.
Many of our example problems and motivations come from the Visualizing English Print project.

You must log in to post a comment. Log in now.