Dataset: This use case uses Mushroom dataset and considers a testing set of 2,000 (of 8,124) randomly selected instances.
Classifiers: We consider adapting a classifier to identify poisonous mushrooms. The initial training of the baseline classifier uses the color feature, but we built a new classifier that does not use this feature. We consider two approaches to imputing the missing color feature by using the mode of the data and training a decision tree to classify the color based on other features. Therefore, in addition to the baseline classifier, we build two new models: mode and smart that use the imputed versions of the color feature.
Walkthrough:
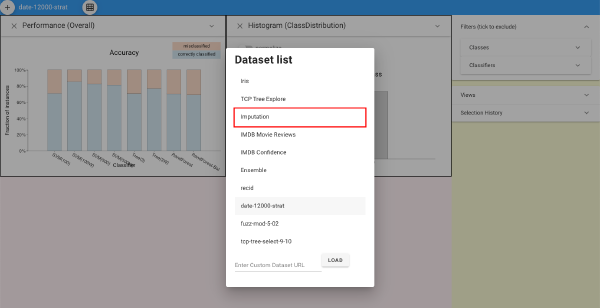
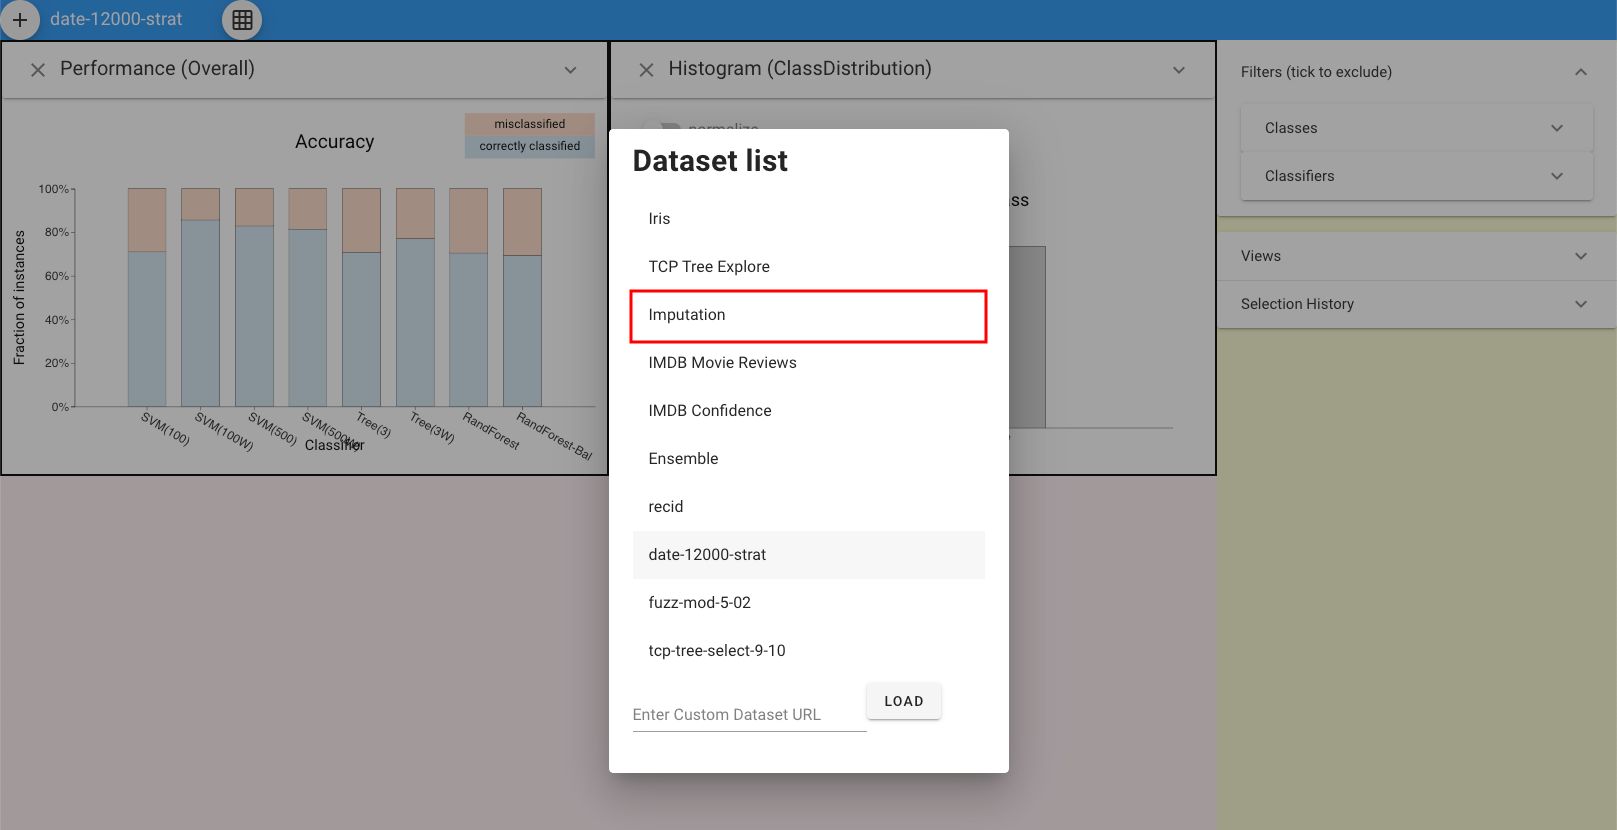
First, click the button on the top left and load the dataset.
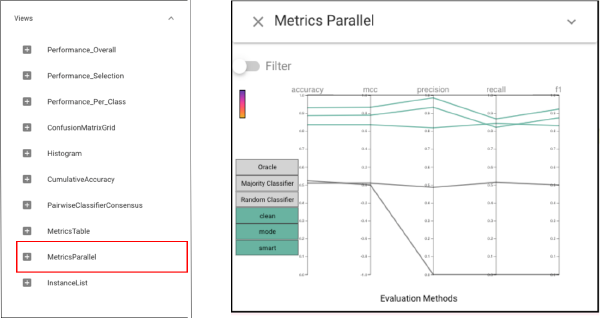
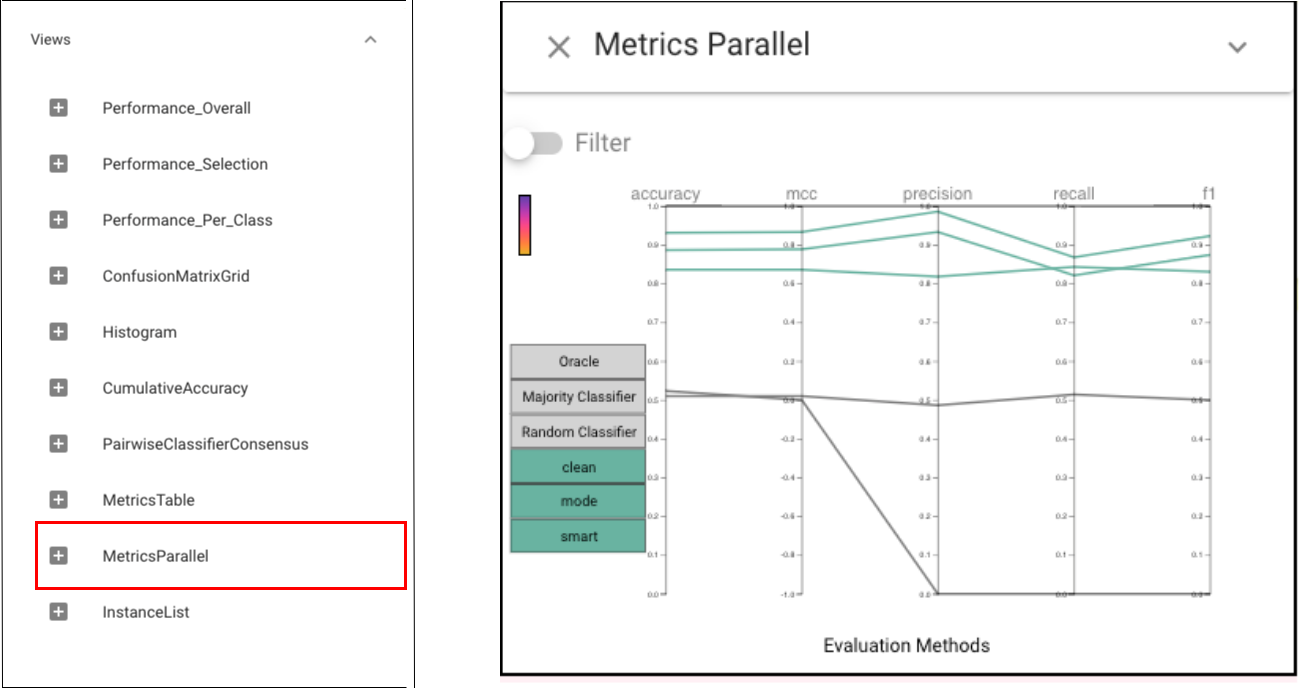
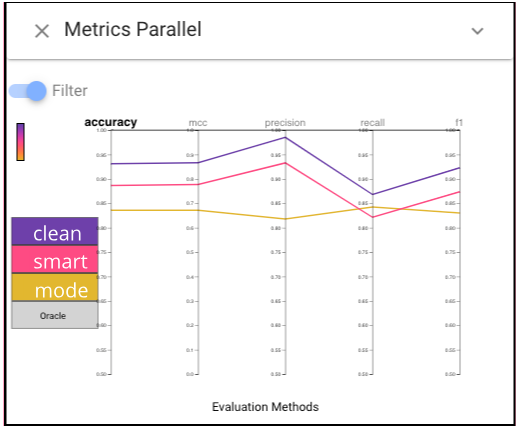
In order to have an overview of the performances of each classifier, we can first choose the Metrics Parallel view.To make it easier to see, we can switch on the “Filter” button to filter the classifiers whose performances are worse than the random classifier, and we can also click the “accuracy” to make sort classifiers by accuracy.The Parallel Metrics view shows that the imputed models perform worse than baseline on all metrics. In addition, the smart model performs better than mode on all metrics except
recall, which is likely to be important (we don’t want to eat a poisonous mushroom).
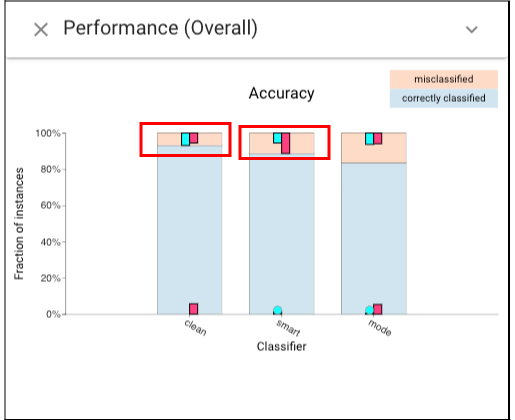
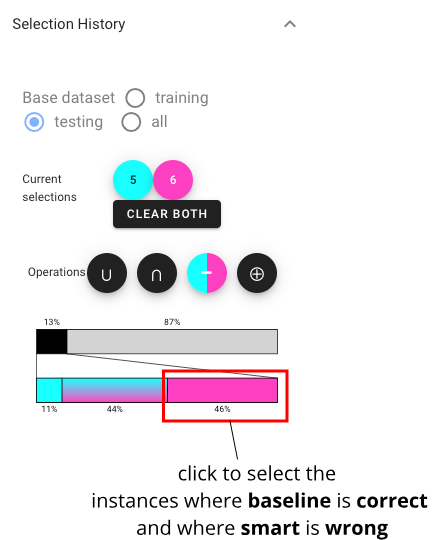
To understand these differences, we can open the Classifier Performance view and select the instances where the baseline and smart classifiers are incorrect (left-click the instances which are wrongly classified by “clean” classifier, and right-click the instances being wrongly classified by “smart” classifier):
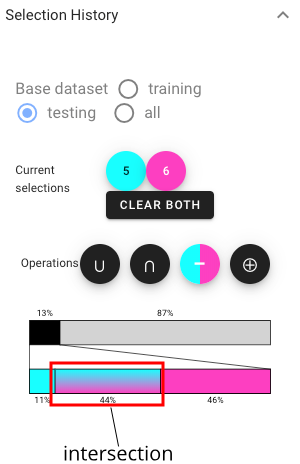
By expanding the selection panel, we can get the information about the intersection among two selections:we find that the latter is almost a proper subset of the former.
We wish to understand if the lower performance of the smart classifier can be attributed to imputation mistakes. We select the instances where the baseline is correct and where smart is wrong, and intersect them:
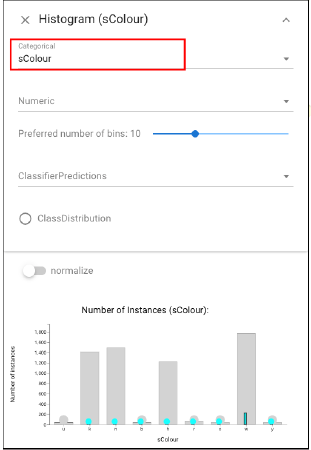
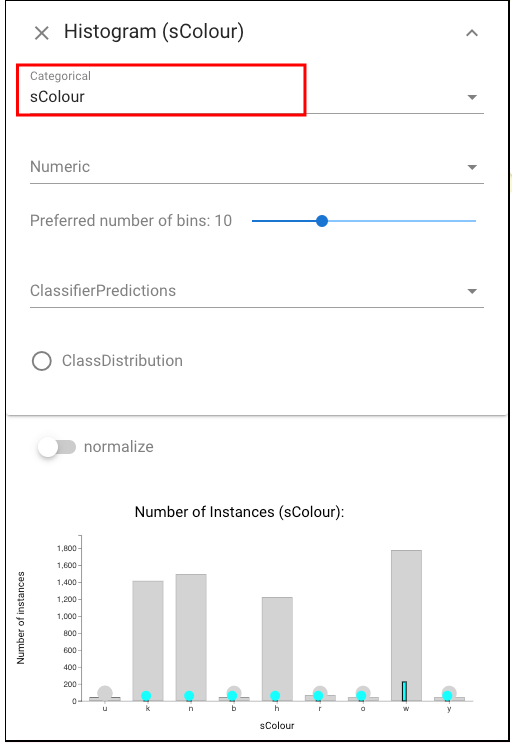
To further explore the detailed features of these sets, we can apply Histogram view here and select the color feature:we see that most of the errors are white mushrooms. Looking at the imputed feature over this set, we see that the smart imputer never labels these as white. These mistakes of the imputer likely cause the misclassifications.