Dataset: The data set is a collection of 554 plays written in the Early Modern Period (1470-1660). Five linguistic features are used. We classify plays with one of four genres (Comedy, History, Tragedy and Tragicomedy).
Classifiers: Our experiment uses a Support Vector Machine (SVM) classifier trained with class weights to counteract a skewed training distribution. A stratified sample of 20% was removed as the test set. The training set has very few of the underrepresented classes
Walkthrough:
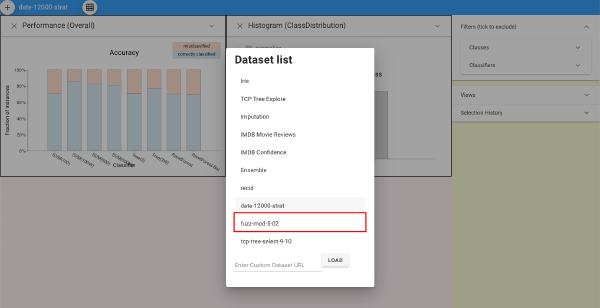
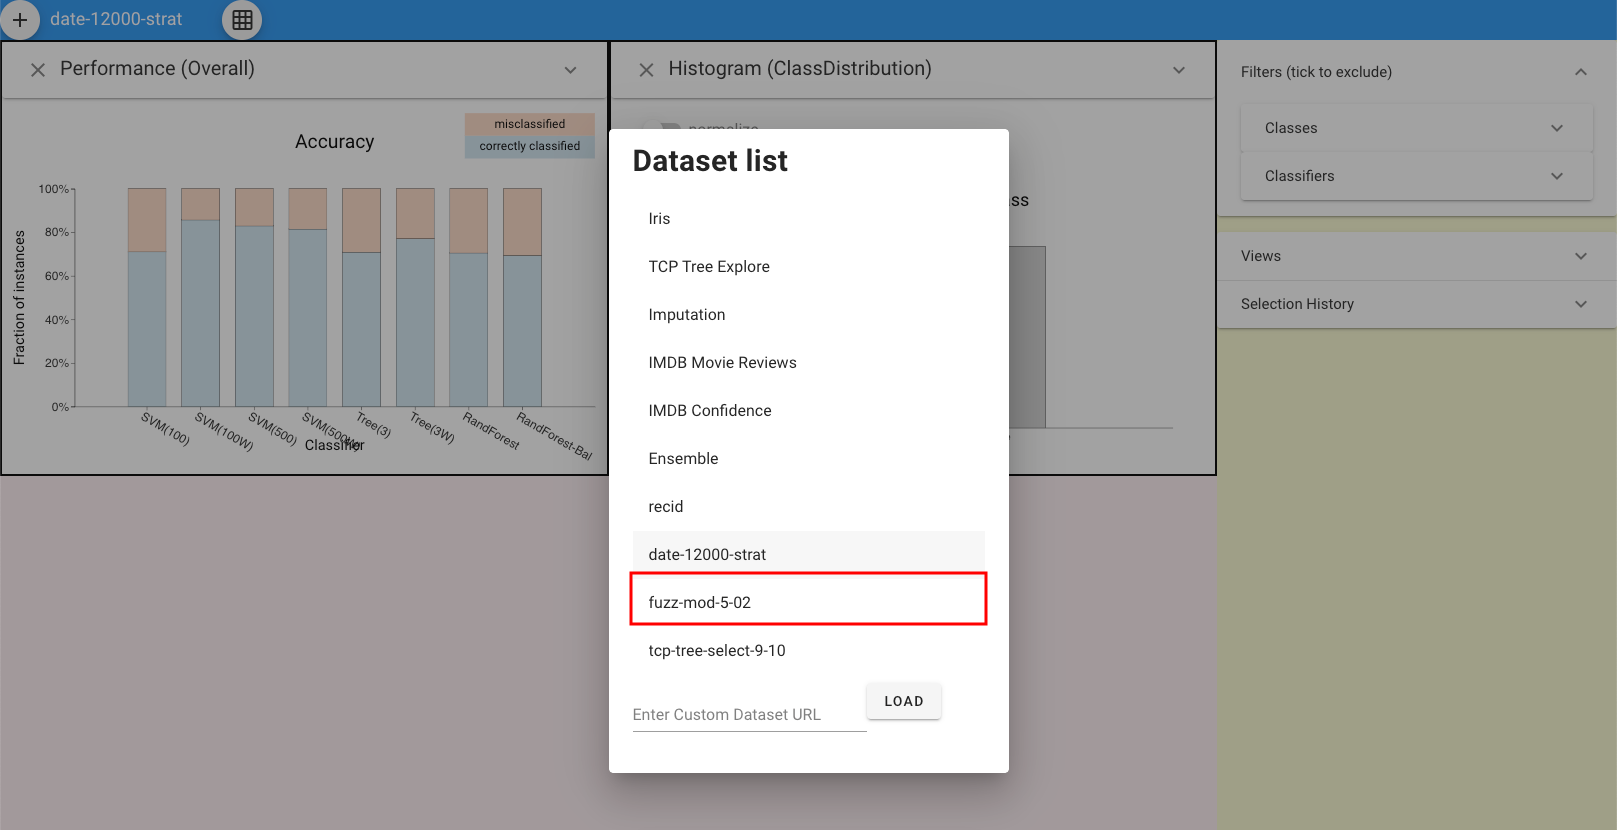
First, click the button on the top left and load the dataset.
After model training, a feature sensitivity experiment identifies which features contribute to the classifier’s performance. We create a variant of the data set for each feature. In each data variant, small perturbations (positive and negative) are added to its corresponding
feature’s value for all entries in the data set. The resulting data sets have twice as many items as the original (one for positive additions to the feature, one for negative ones). Each data variant is run through the classifier. Here, we consider only the testing set.
Such experiments are preferred to simply examine model coefficients because they test the effects of the variables near the actual data.
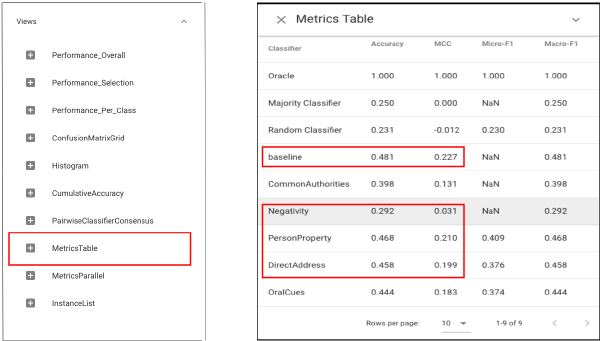
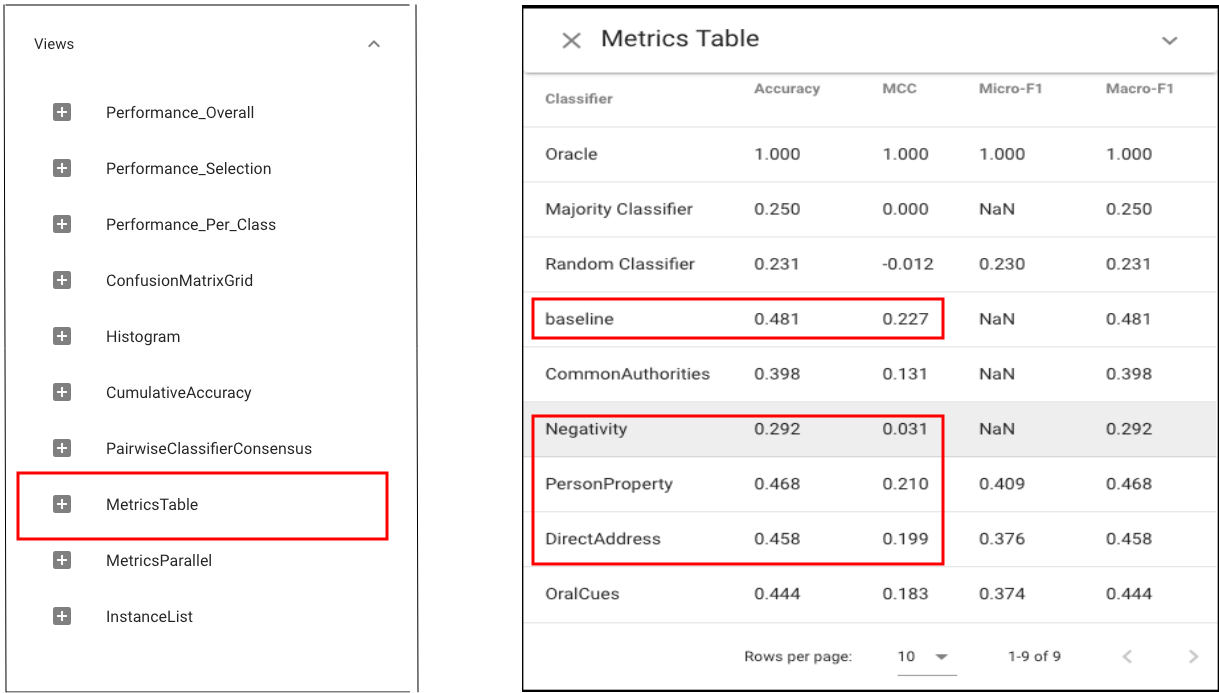
Let’s first use Standard Metrics view to compare the performance of each classifier:The experiment results show that for feature Negativity (N), the classifier performs much worse than the baseline (accuracy and Mathews correlation).
What’s more, two features PersonProperty (PP) and DirectAddress (DA) achieve similar performance to the baseline.
Standard procedure would conclude that the classifier is sensitive to N but not PP and DA. However, closer examination in Boxer reveals otherwise.
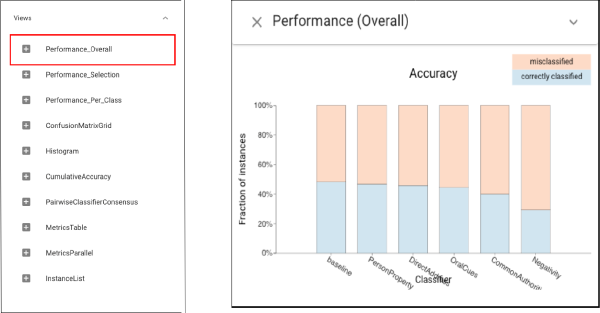
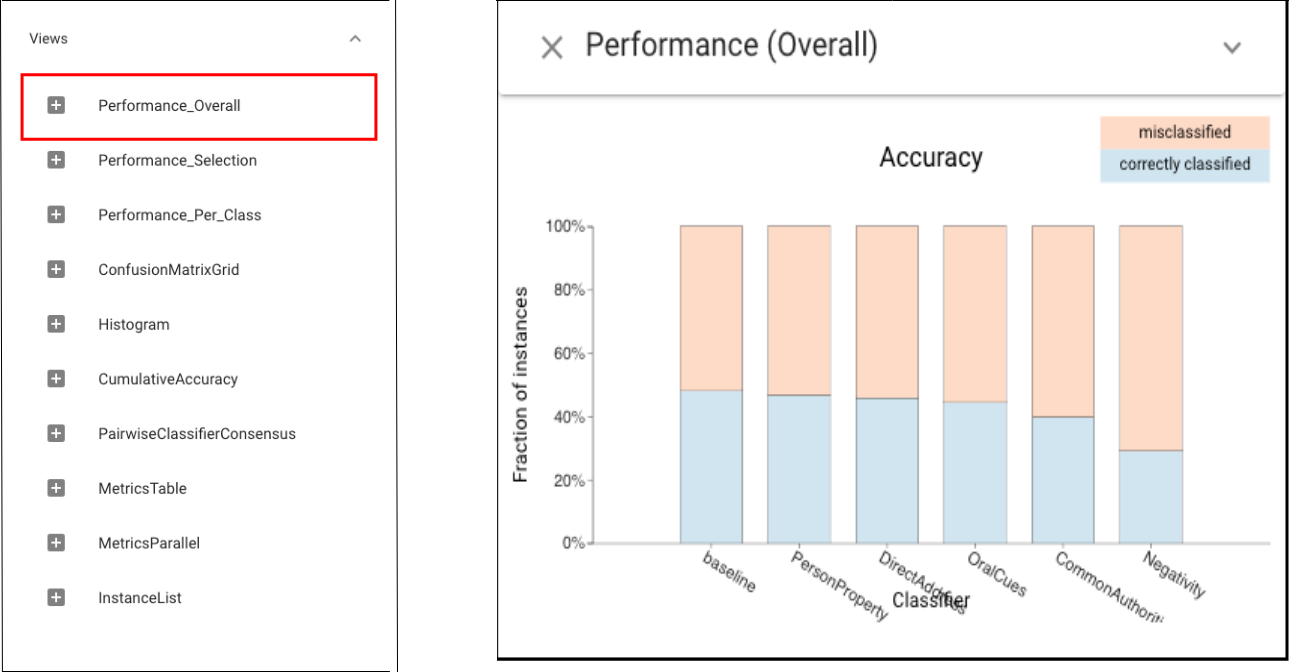
The Classifier Performance view shows that PP and DA have similar accuracy to the baseline:
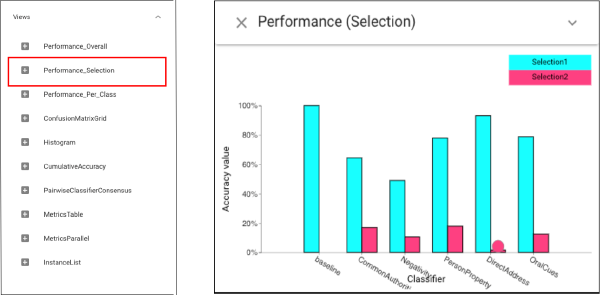
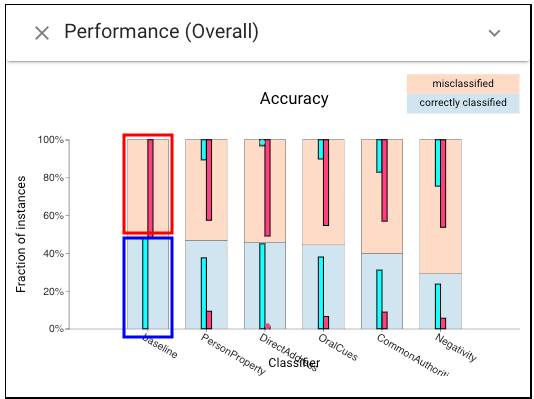
Then, let’s select the correct and incorrect subsets for the baseline and it allows us to compare with the perturbed results ((left click on the lower box, cyan selection; right click on the upper box, magenta selection):
To further analyze the performance of classifiers based on selection, we can use Selection Performance view:For DA, the overlaps are substantial, for PP there is less overlap. While PP gets the same number of instances correct, it is correct on different ones, suggesting the model is sensitive to this feature.