Dataset:
We consider a standard test case for fair learning: the Broward County recidivism dataset, popularized by ProPublica. The data set contains 6,172 instances and 14 numeric features (created by one-hot encoding the categorical features in the initial seven feature data set). 20% are held for testing.
Classifiers: The task is to predict whether a person will commit a crime within two years (two-year recidivism). Classifiers built for this problem are often unfair in that they skew errors towards racial and gender bias. We consider three classifiers trained on the data, a baseline random forest, and two hand-tuned variants (C3 and Pos).
Walkthrough:
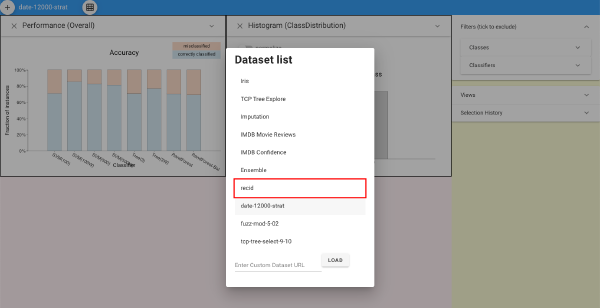
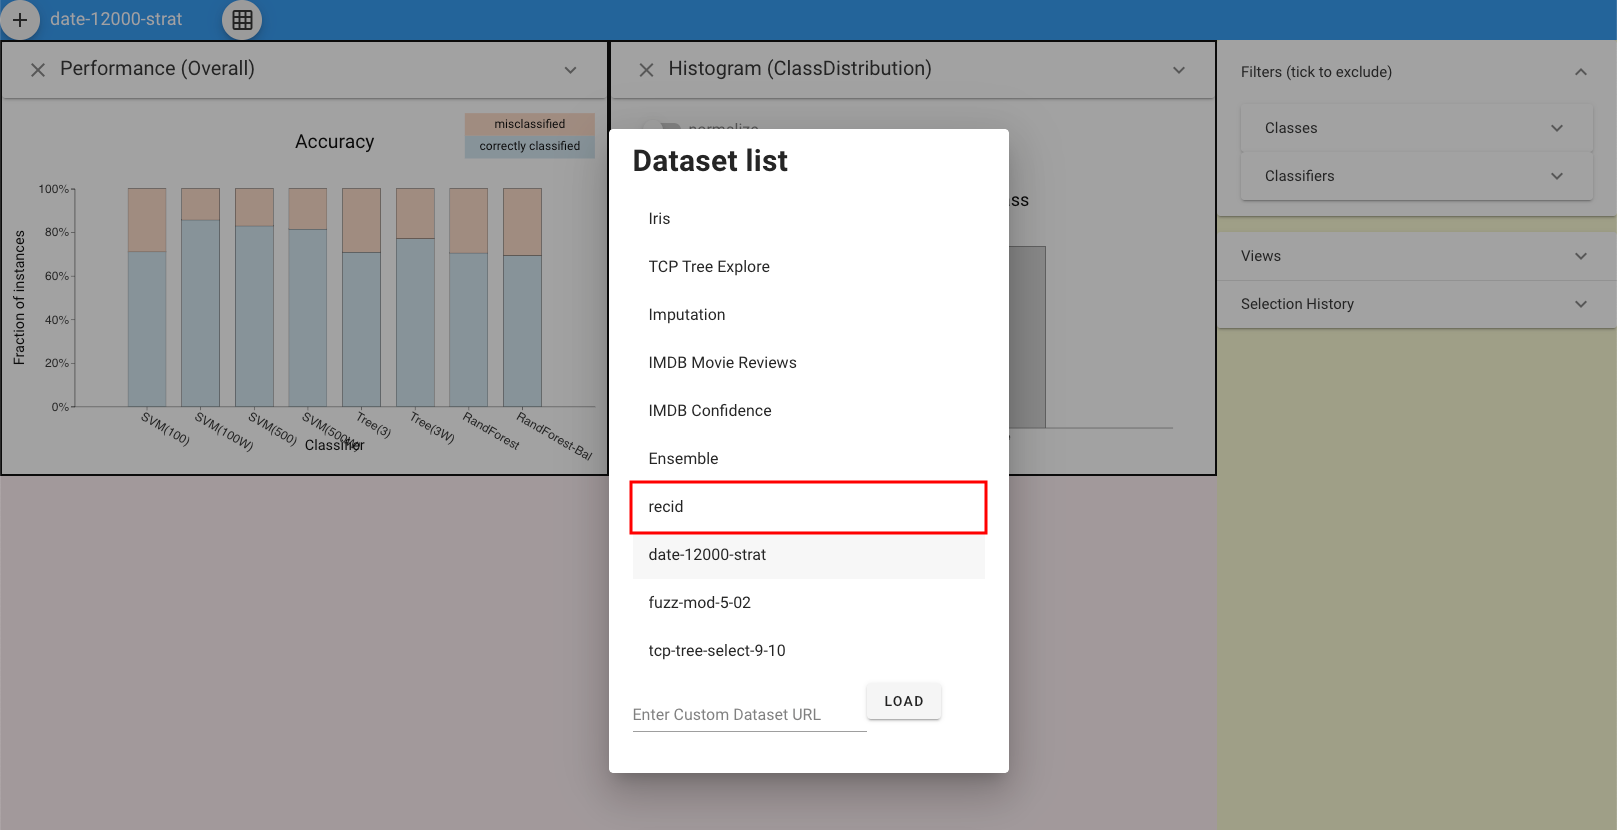
First, click the button on the top left and load the dataset.
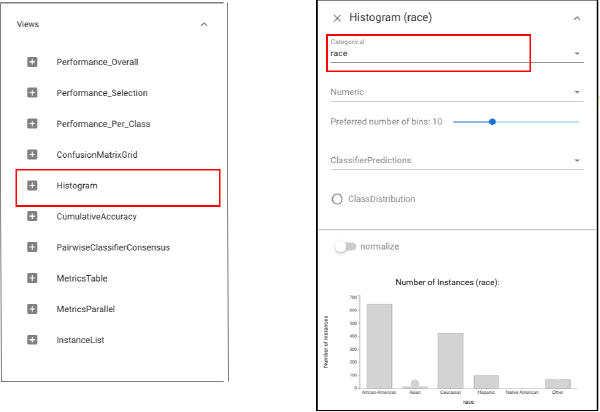
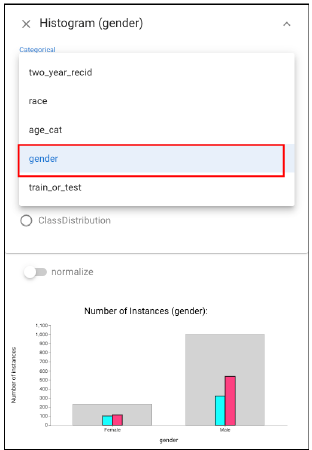
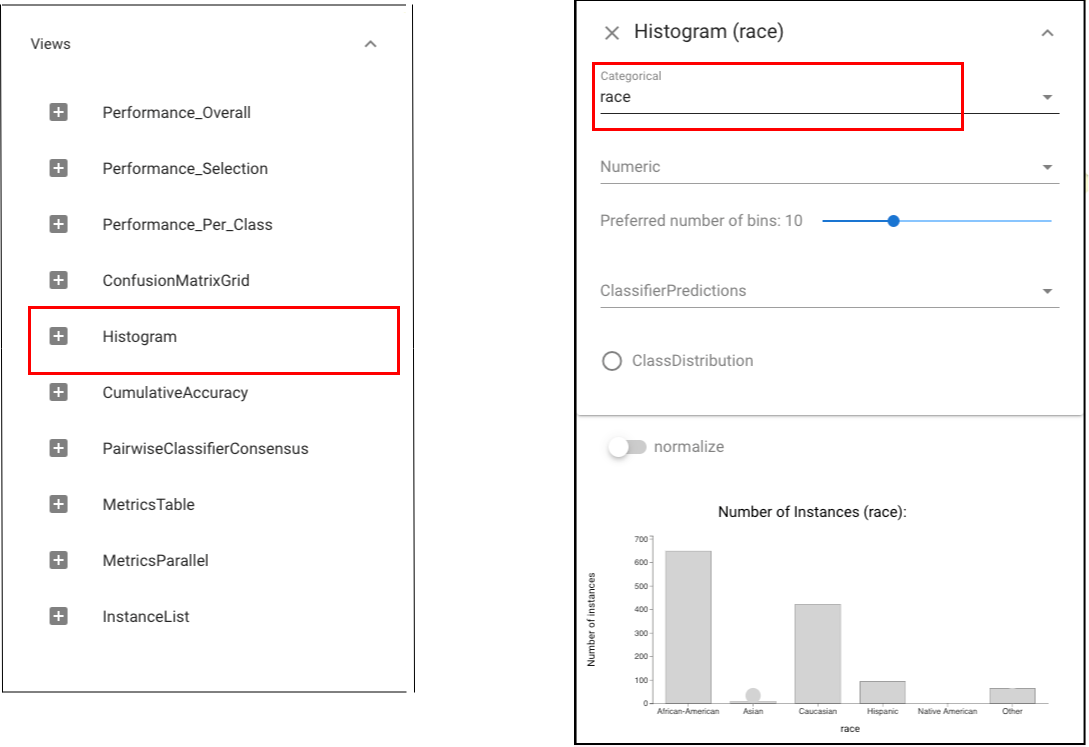
Since we are comparing within a specific category - race, we need to select data by category. To do this, we should open Histogram view and click the arrow at the top right corner of the view. A dropdown menu will appear. Select the category “race”.
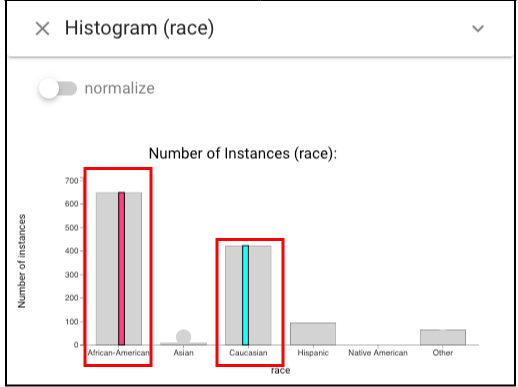
In order to see whether classifiers perform fairly when dealing with different races, we should pick two kinds of races to select in Histogram view. Left click the bar labeled “Caucasian” and right click the one labeled “African-American” and they will be highlighted with cyan and magenta respectively.
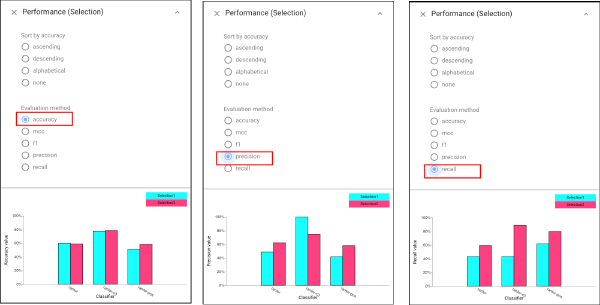
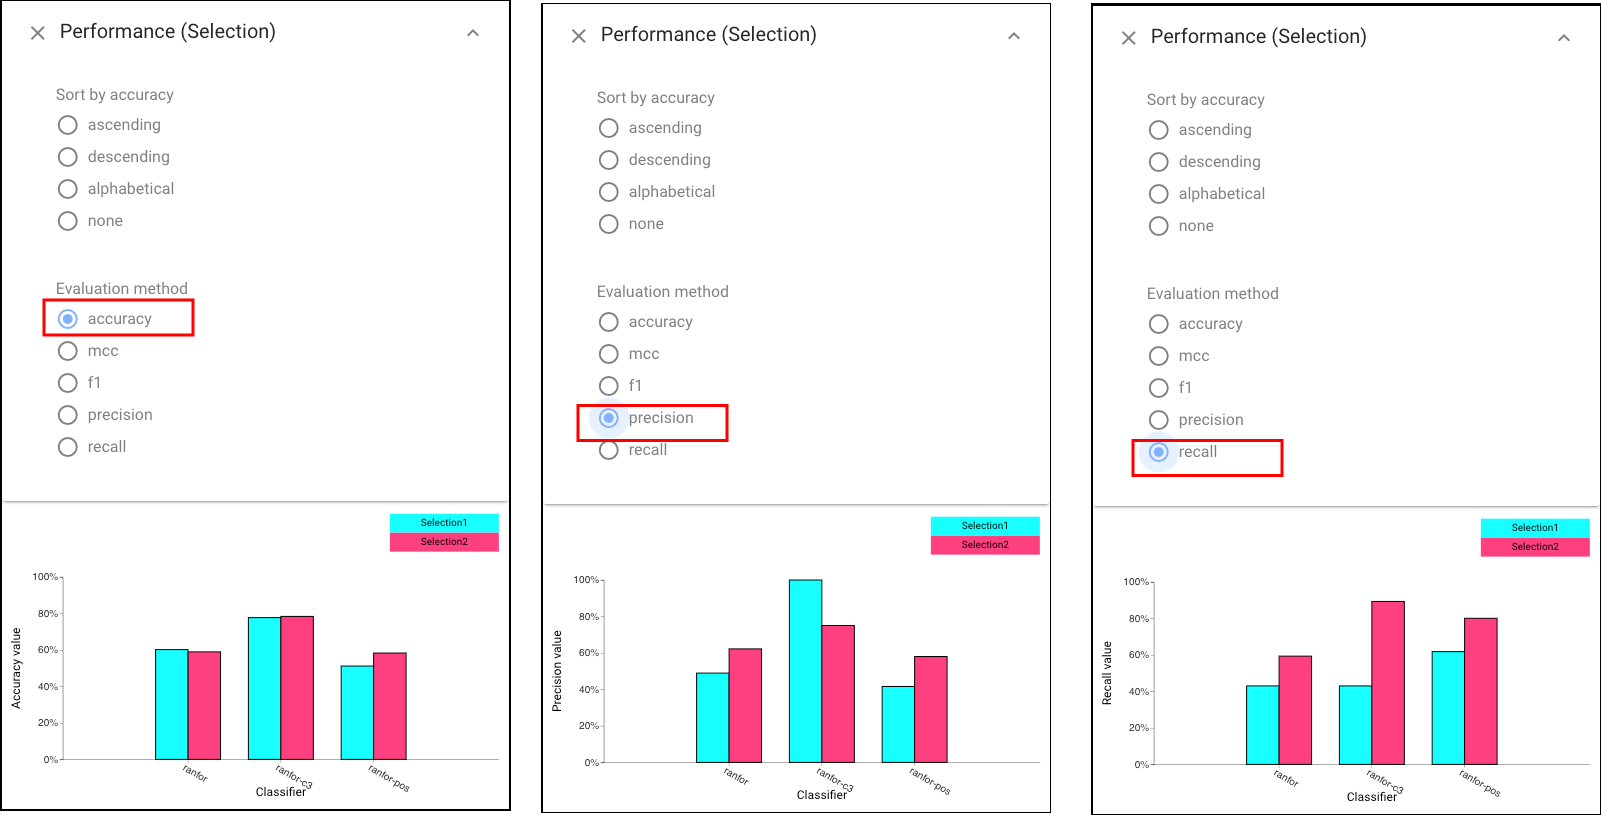
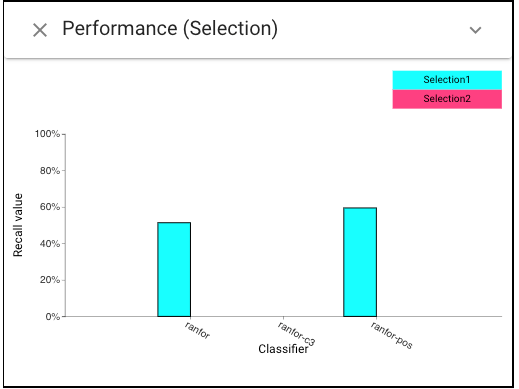
Then we can use Selection Performance view to see the fairness achieved by each classifier.
We can first see the “accuracy” achieved by each classifier based on two selection (left view). Then we can choose to display the “precision” (middle) and “recall” (right) by selecting relative buttons on the panel.
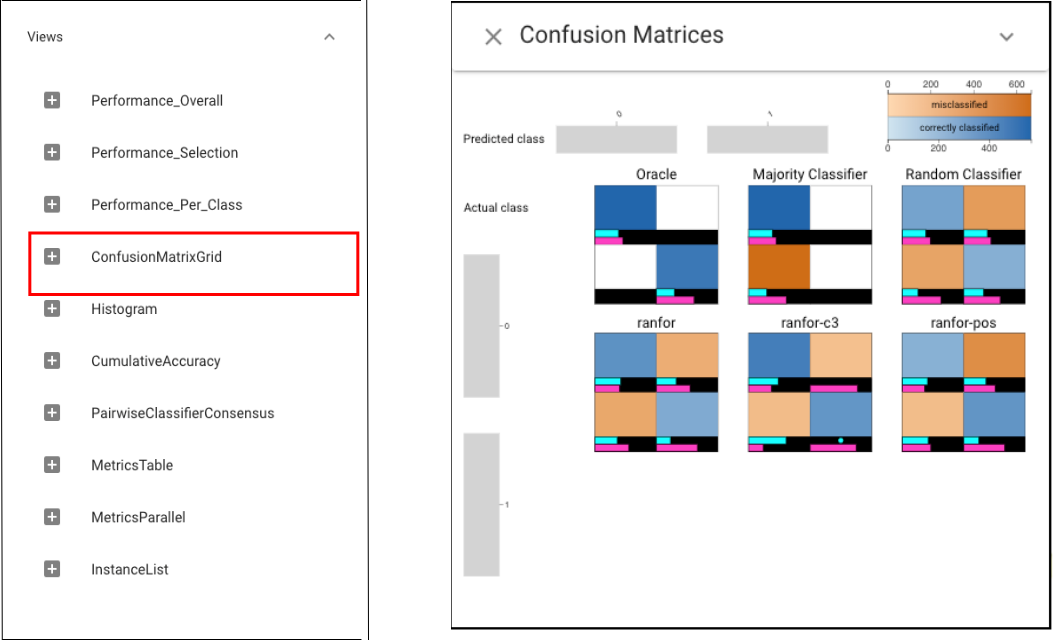
We can find that while Selection Performance view shows similar accuracies for the selections, the precision and recall are very different. In addition, C3 has high precision but low recall for “Caucasians”, and high recall but low precision for “African-Americans”. That is, its errors are biased to predict no for “Caucasians” and yes for “African-Americans”. While other classifiers make more errors, their errors are more uniformly distributed. To further compare classifiers based on their prediction profile per class, we can apply Confusion Matrix Grid here:
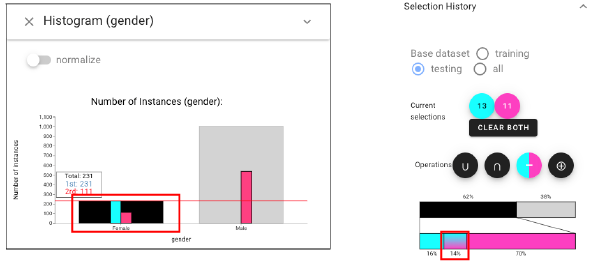
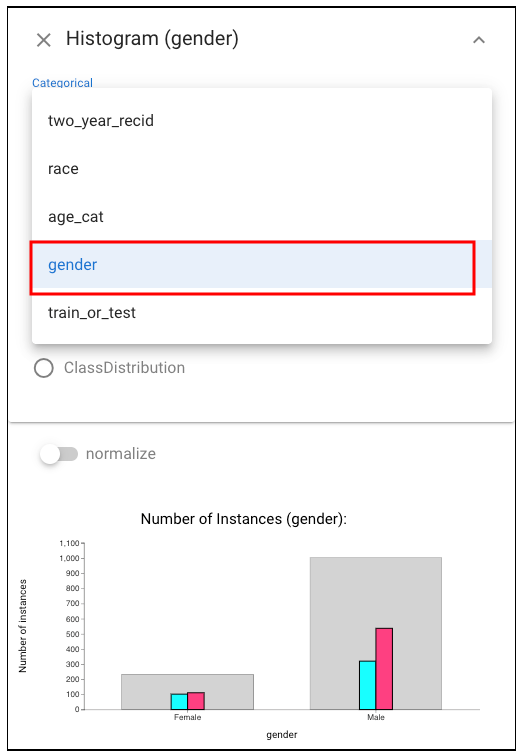
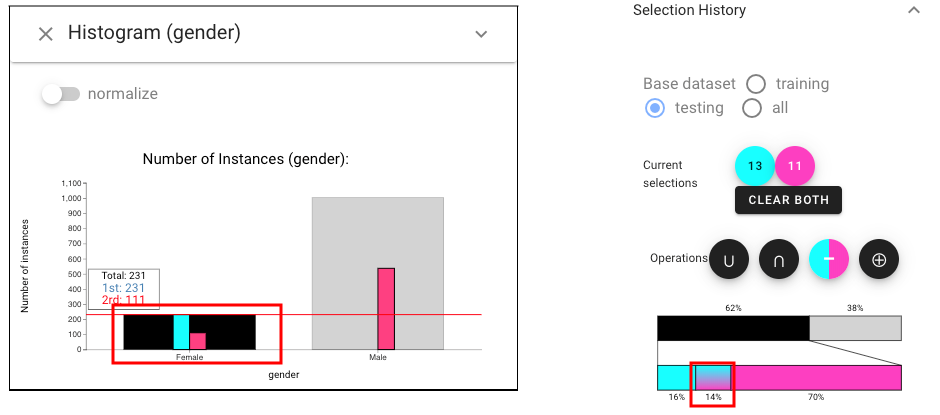
To explore further, we consider the effect of gender. We open another Histogram view, expand the panel above, choose “gender” :Then, we select the subset of female instances by using “left-click” in a histogram (left view) and intersect this with the African American subset (right view: using the relationship widget).
Back to the Selection Performance view and choose to display the “recall”, we can notice C3 has very 0 recall on this subset of African American females, while other classifiers achieve more balanced performance.