Hyper parameter Tuning #
Dataset: The scenario uses wine quality benchmark from UCI Machine Learnng Repository, which requires classifying the quality of a wine from its properties.
Classifiers: Because we are trying to determine a hyper-parameter, we perform this analysis using the training data. We build a random forest classifier, and find that it gives good performance over a range of thresholds. We want to understand if changes in the threshold affect the outcomes
Walkthrough:
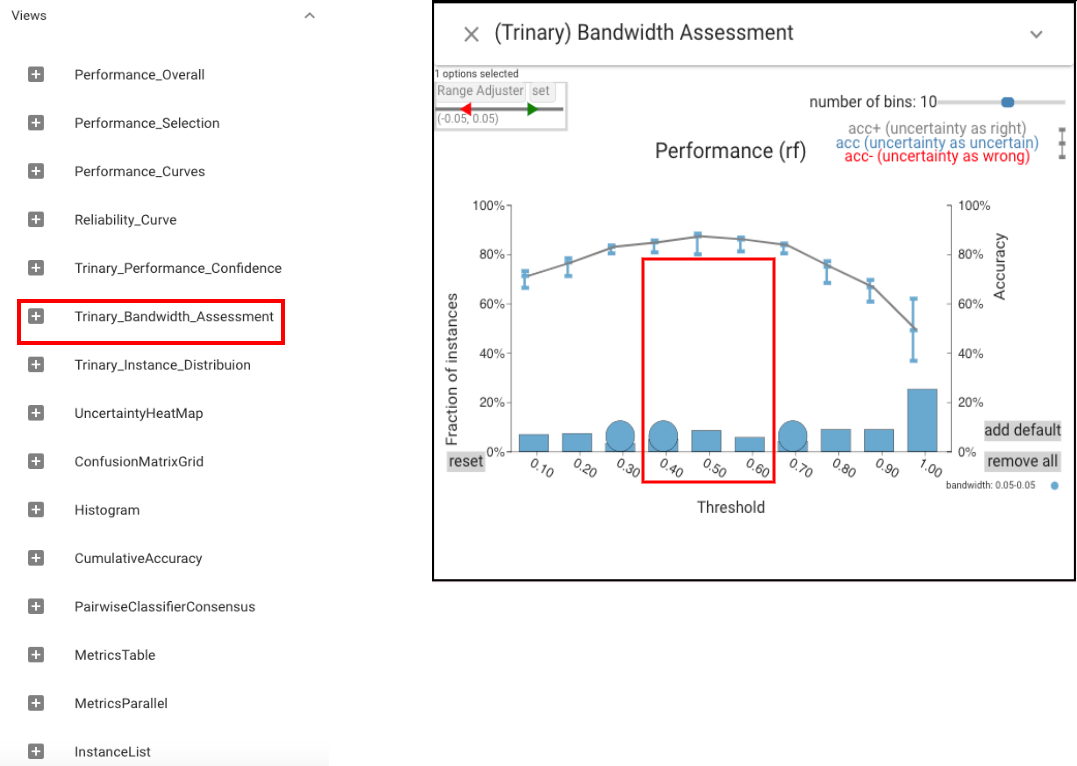
After loading the data, let’s first open the Bandwidth Assessment view.
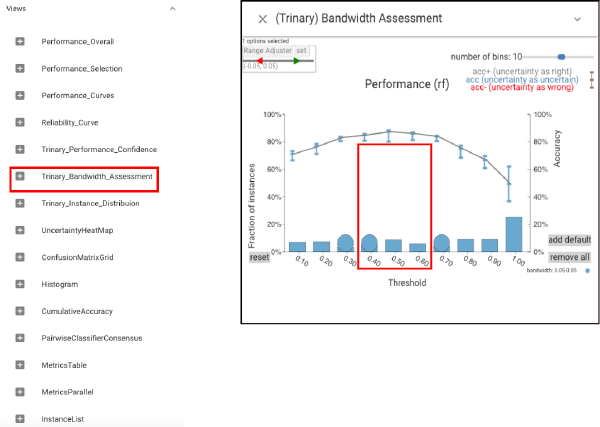
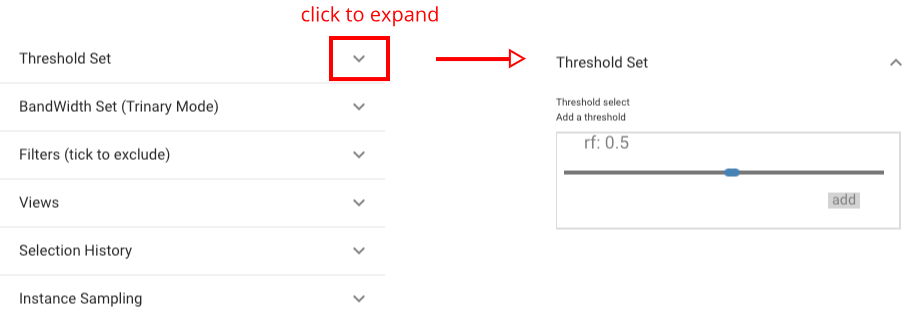
We see that the accuracy is constant for thresholds around .5. Then we use the Probability Control panel to adjust the threshold.
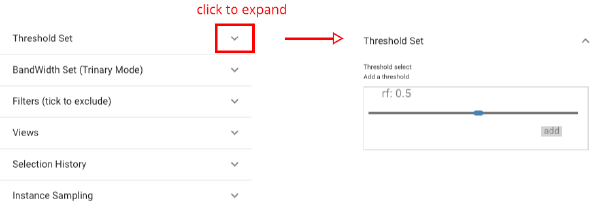
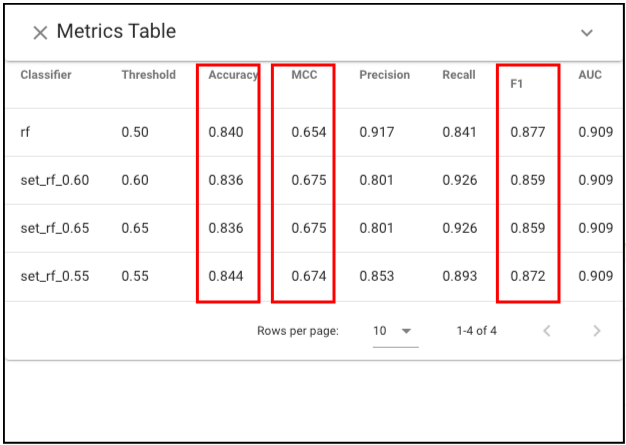
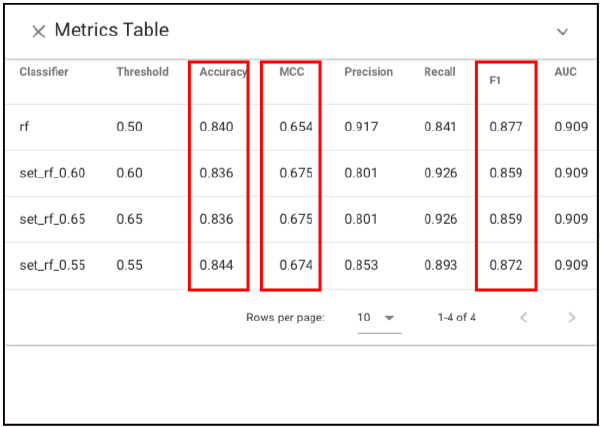
For several values in the range, we create new classifiers that use the same model with different thresholds (.5, .55, .6, .65) and compare these models.
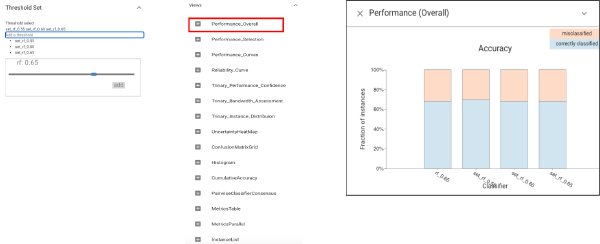
We see that accuracy, F1 and MCC scores are very similar across the four.
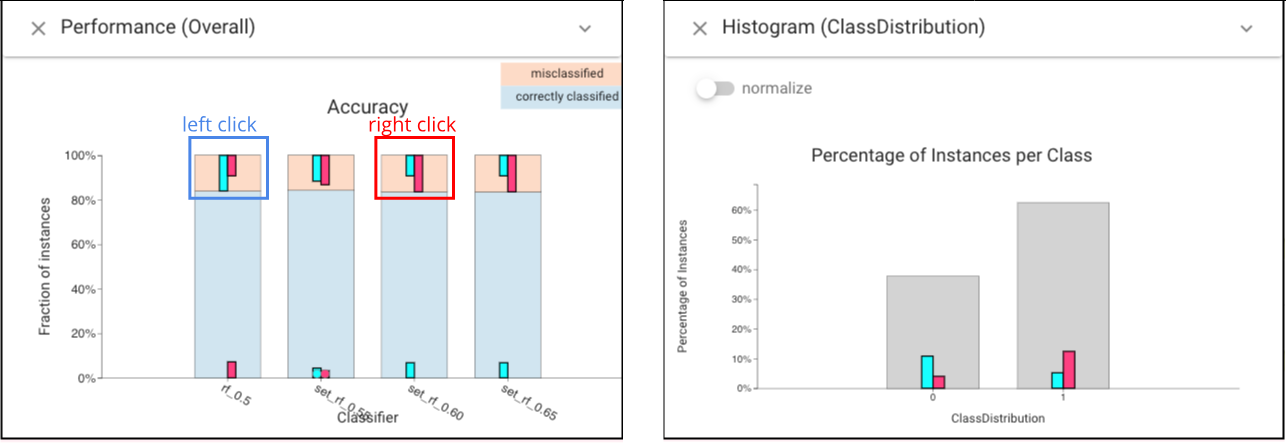
However, if we select the errors (left click to select the errors when threshold is .5, and right click to select the errors when threshold is .6), we see that they are different:
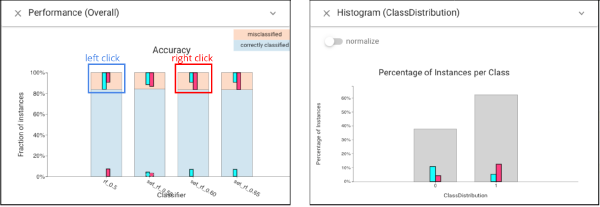
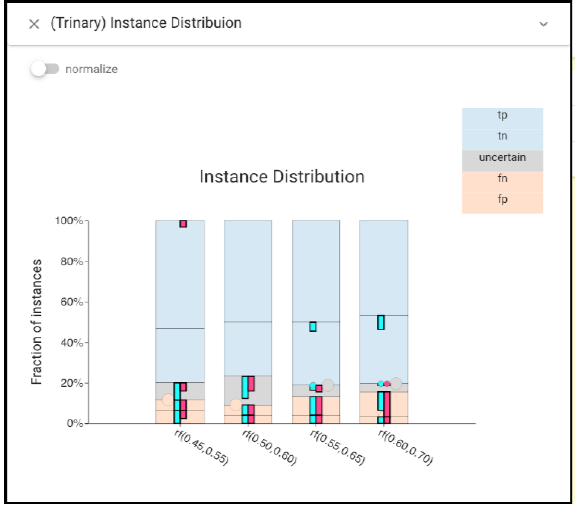
For the lower thresholds, there are more false negatives, while for the higher thresholds more false positives. Trinary Instance Distribution view also shows this.
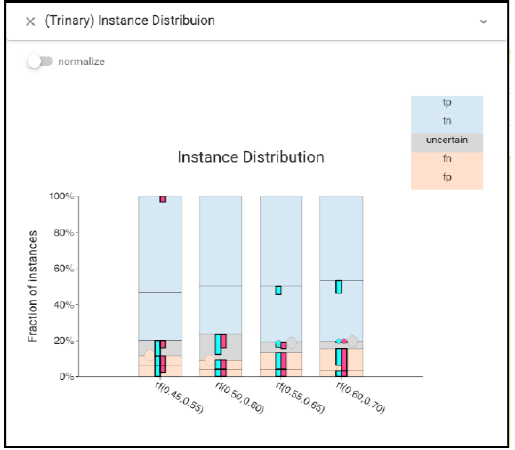
In conclusion, this classifier is quite sensitive to small changes in the threshold, even though those changes do not affect the most common metrics.