Model Selection and Calibration Analysis #
The scenario is an example where the cost of a false negative error (not warning a patient of a potential problem) is more costly than a false positive (which may cause extra caution, or fear). It is also a scenario where a “no-prediction” option is viable, recommending that patient is tested further has a lower cost than an error.
Dataset: The Heart Disease prediction dataset is a standard data set used in machine learning education. Classifiers are trained to predict if a patient is likely to develop a disease (binary decision).
Classifier: Three classifiers were trained with different methods (logistic regression (LR), k-nearest neighbor (KNN) and random forest (RF) and load the testing data for each classifier into CBoxer.
Walkthrough:
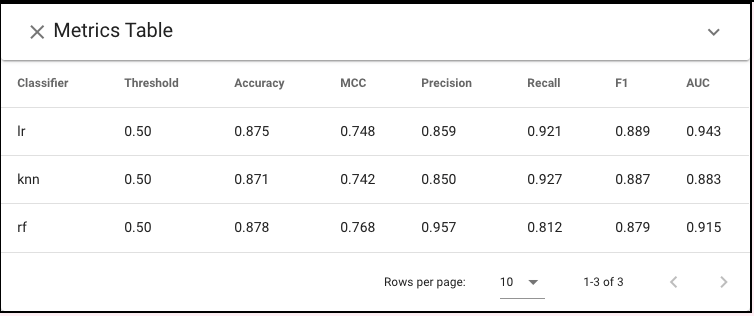
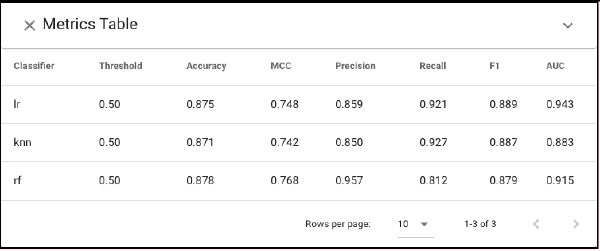
Based on Metrics Table, each model has similar accuracy (87%) and F1 scores (.88). However, given the varied costs we may prefer to penalize false negatives. While RF has a higher Matthews Correlation Coefficient (MCC) score , it has substantially worse recall
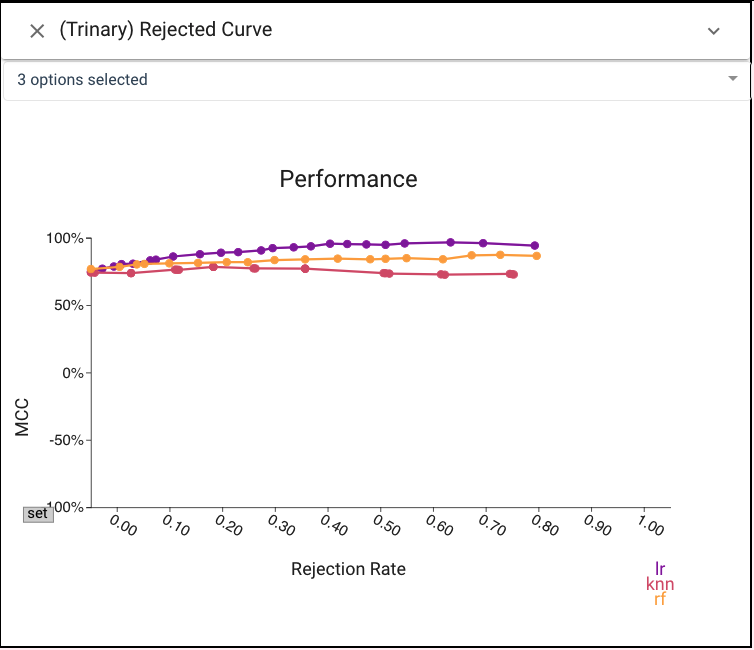
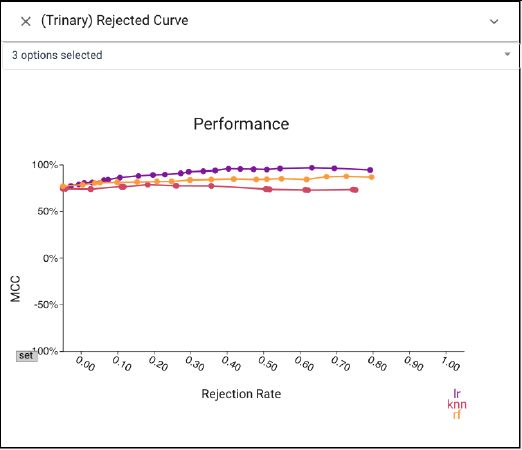
CBoxer allows for examining a variety of metrics or the confusion matrices to perform model selection. Examining the Rejection curve shows that performance still lags even after tuning.
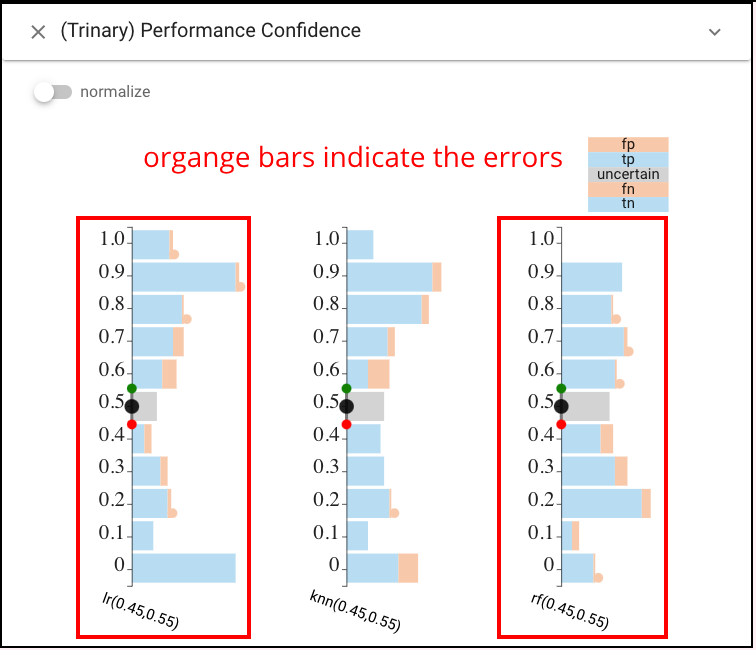
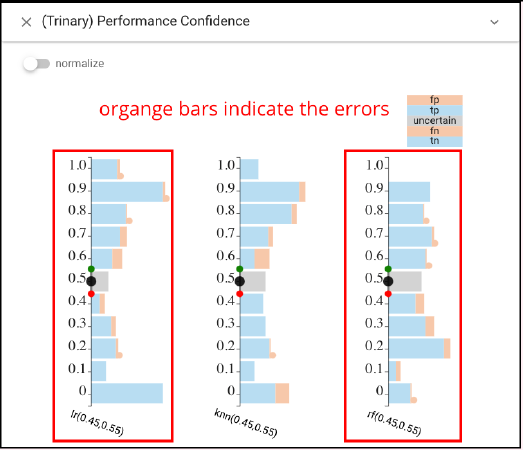
Alternatively, CBoxer’s comparative mechanisms allow subsets of the items to be selected and compared to examine where errors occur. Performance Confidence view shows the errors from LR and RF are distributed differently across the outcomes.
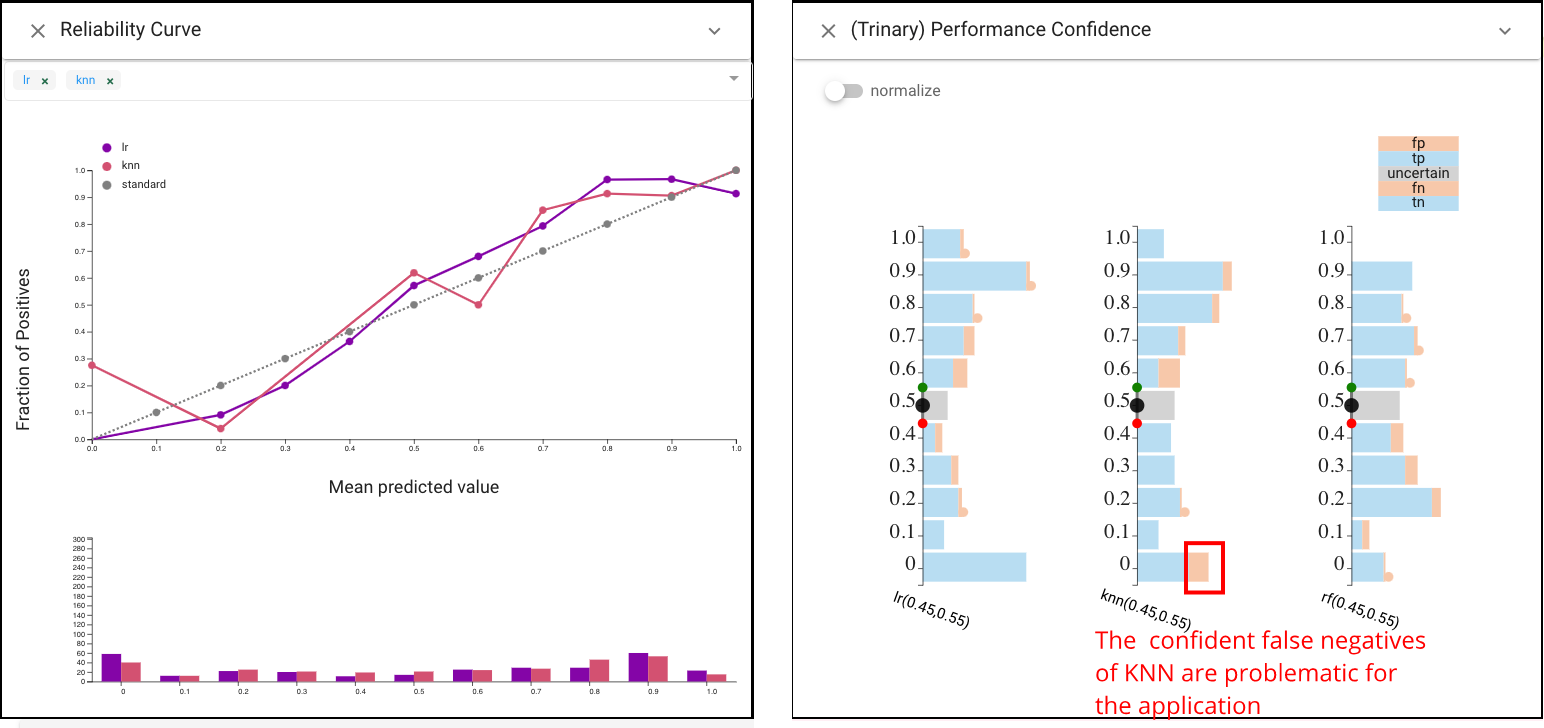
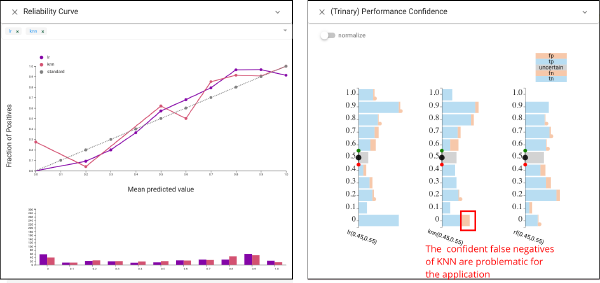
Selecting between LR and KNN is more subtle. To perform model selection based on more detailed analysis, we consider the utility of the scores. We would prefer a classifier that is calibrated such that its scores provide information about the quality of the prediction. While a basic summary measure of score quality (AUC) suggests the two are similar, CBoxer allows us to examine the difference in detail. The Reliability Curve view shows that both are reasonably well calibrated, while KNN has more errors with very low scores. The Performance Confidence view also shows this. The confident false negatives of KNN are problematic for the application.
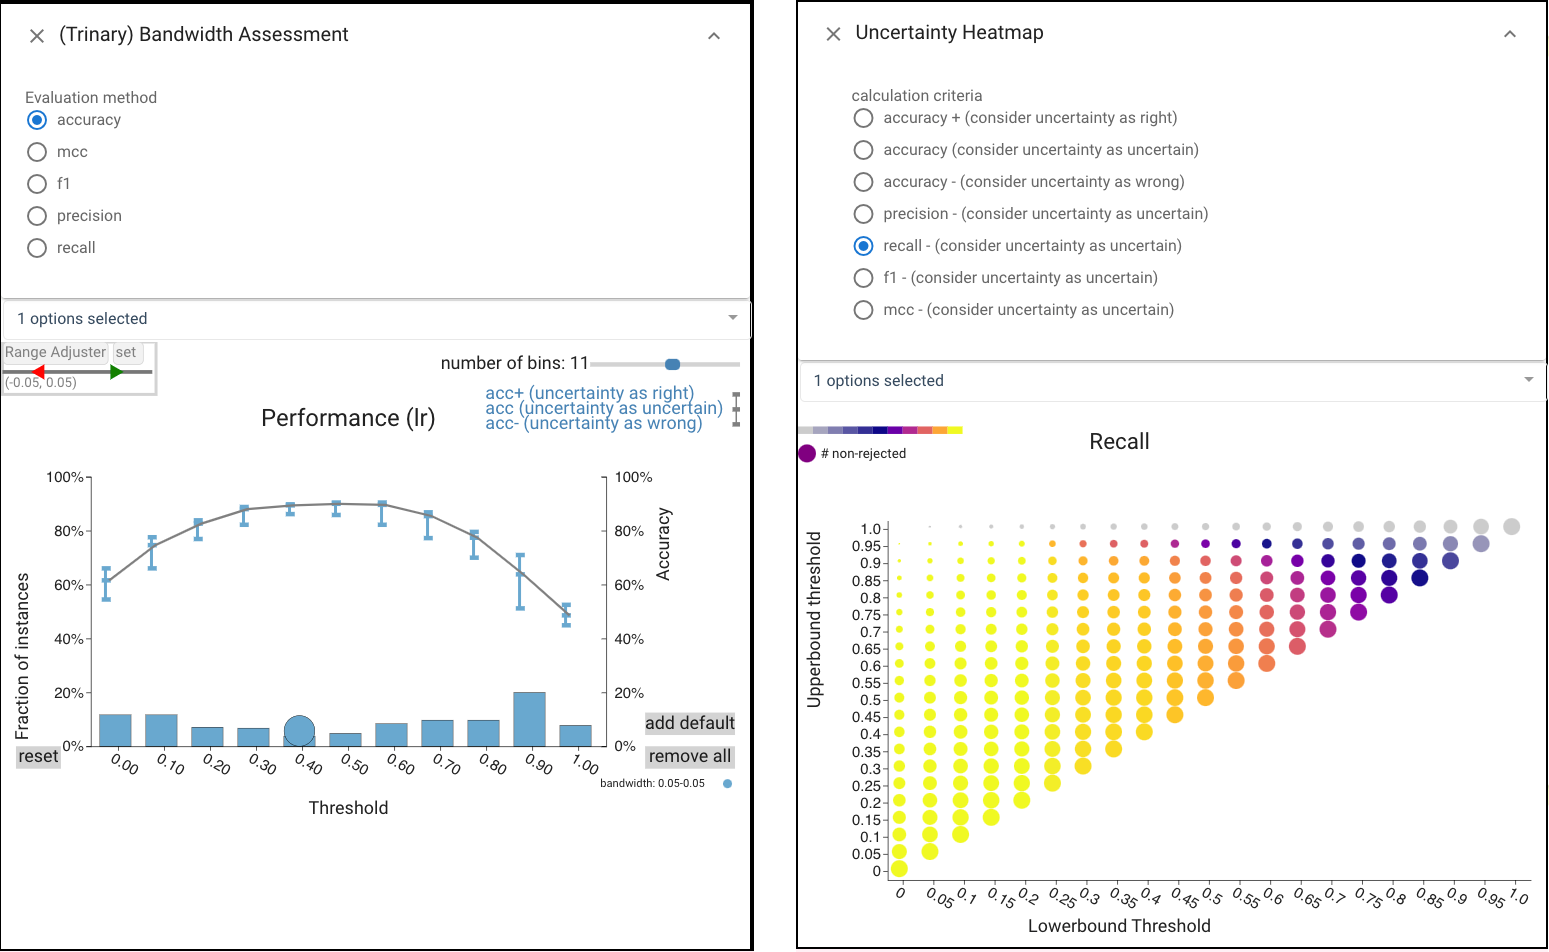
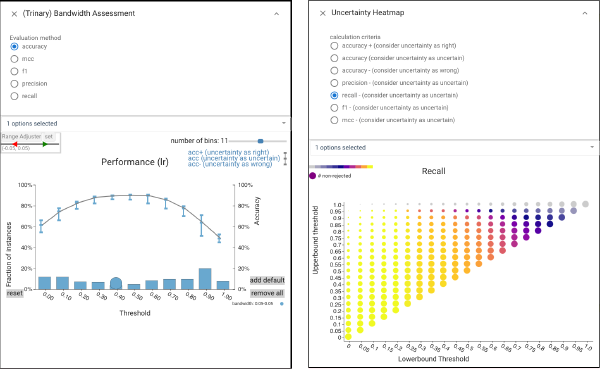
We select the LR classifier. Because the LR classifier is well calibrated, we can use its score to reject predictions that are unlikely to be correct: we create a trinary classifier where middling scores are rejected. This requires defining upper and lower thresholds. In CBoxer, we can manipulate thresholds to see their impacts across various performance summary views. We also provide a number of views to examine trade-offs. The Bandwidth Assessment view, Uncertainty Heatmap view provides summaries about how the two thresholds work together to provide different tradeoffs.
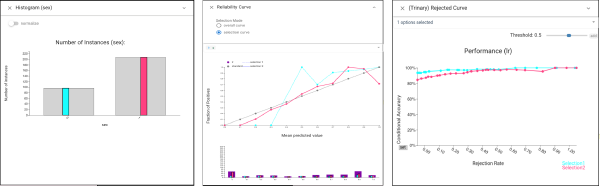
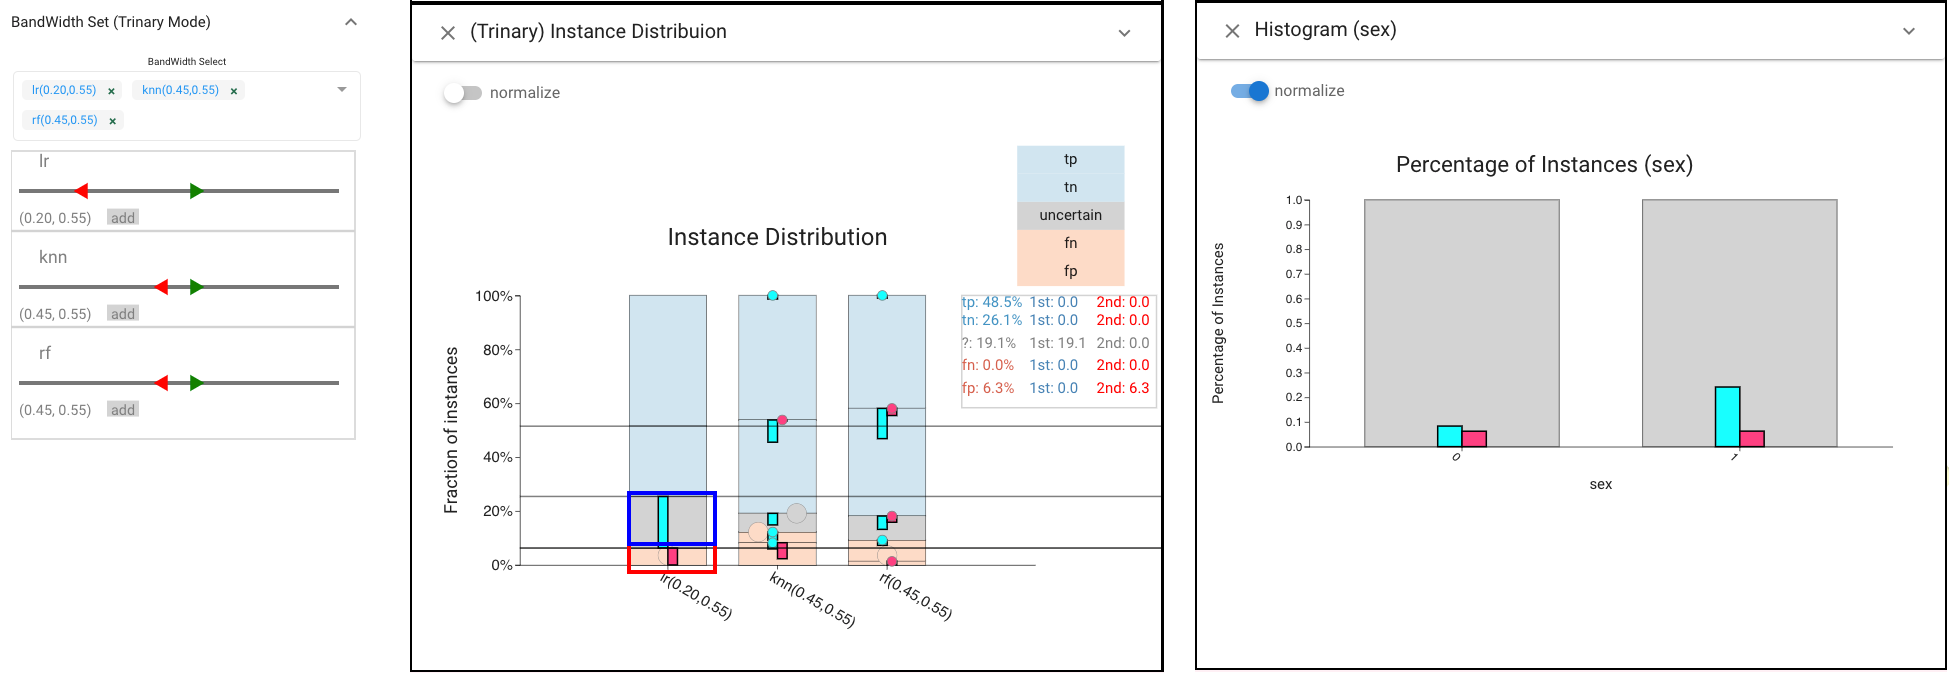
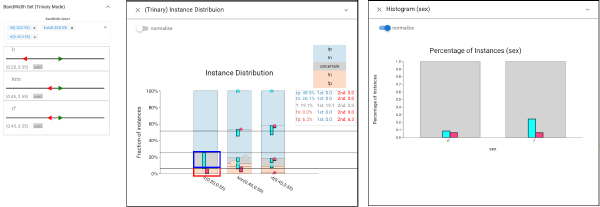
We choose settings that provide high recall with a reasonable (20%) rejection rate (in Threshold panel). We can view the proportion of classified instances in the Trinary Distribution view. We investigate the fairness of this classifiers by choosing its errors (pink selection) and seeing that they are evenly distributed across sexes in Histogram view. However, selecting the rejected items (cyan selection) we see that men are far more likely to receive uncertain predictions.
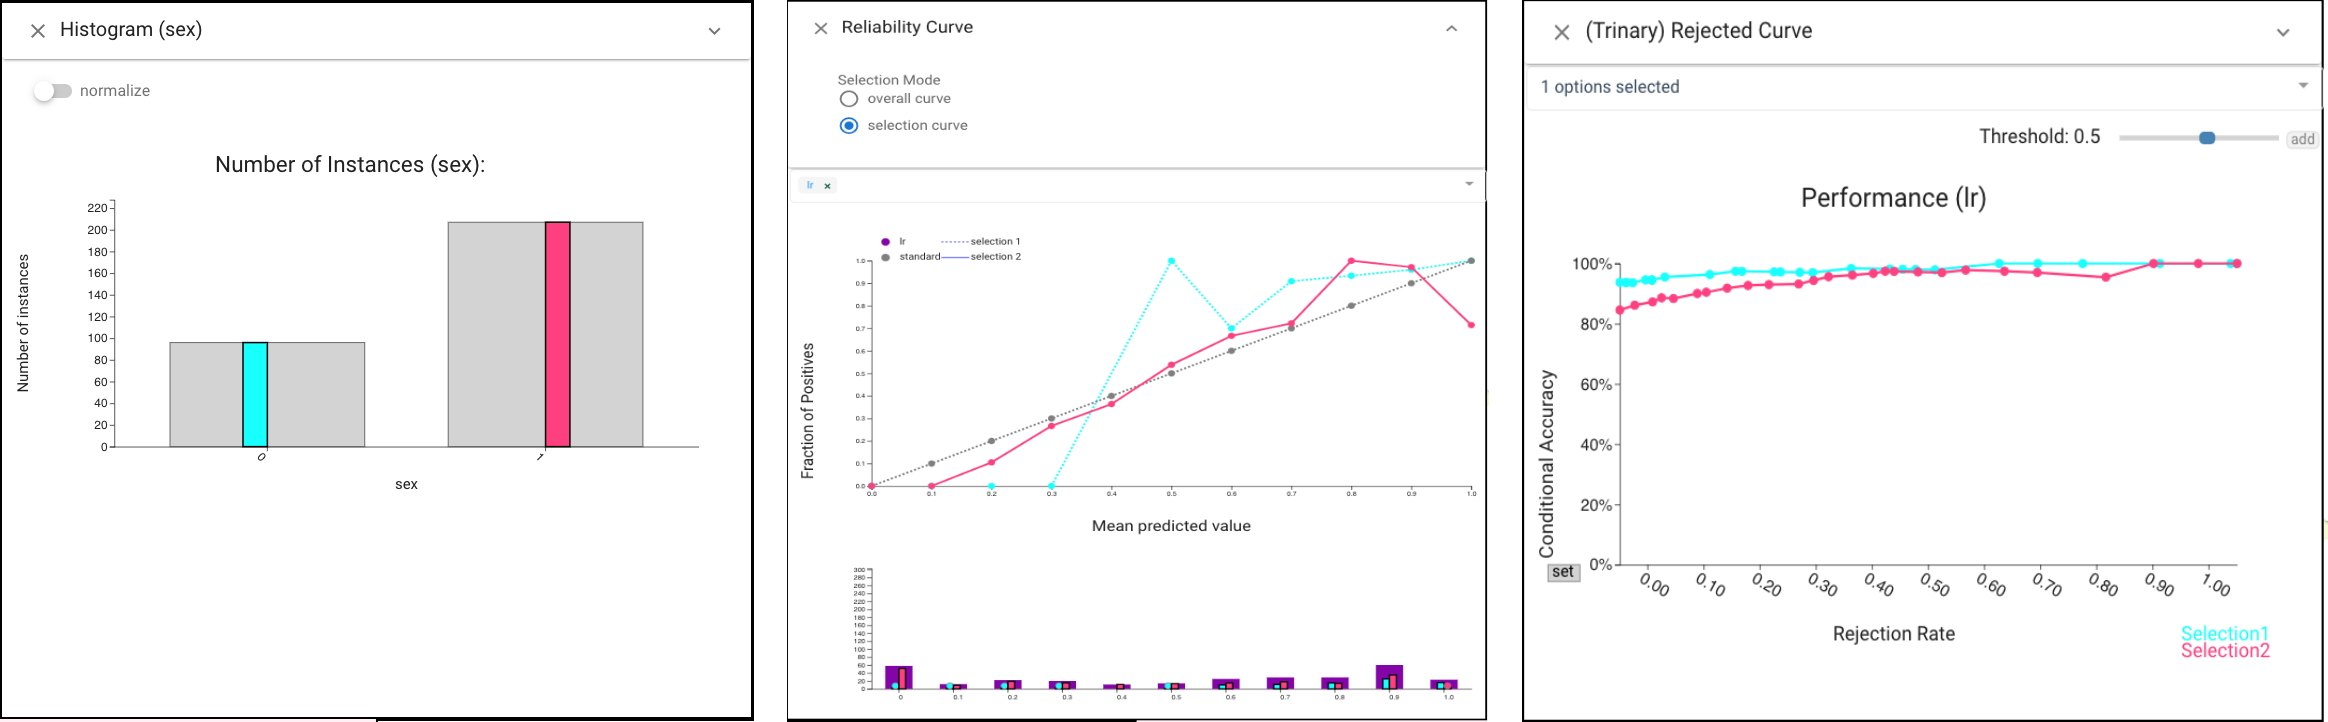
In order to get more detailed information of the difference between man and woman, we select woman and man as the cyan and pink selections. Under the selection mode of Rejection Curve view, we find LR achieves better non-rejected performance in woman group, while the Reliability Curve view indicates the prediction scores in man group are better calibrated.