Model Selection #
Dataset: The scenario uses the income classification benchmark dataset from that has been downsampled.
Classifiers: Classifiers determine whether an individual’s income is above a certain level. Three models were constructed with different methods: multi-layer perceptron (MLP), logistic regression (LR), and Na¨ıve Bayes (NB).
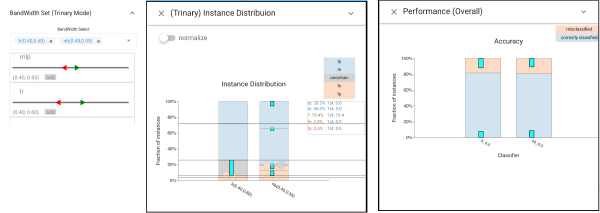
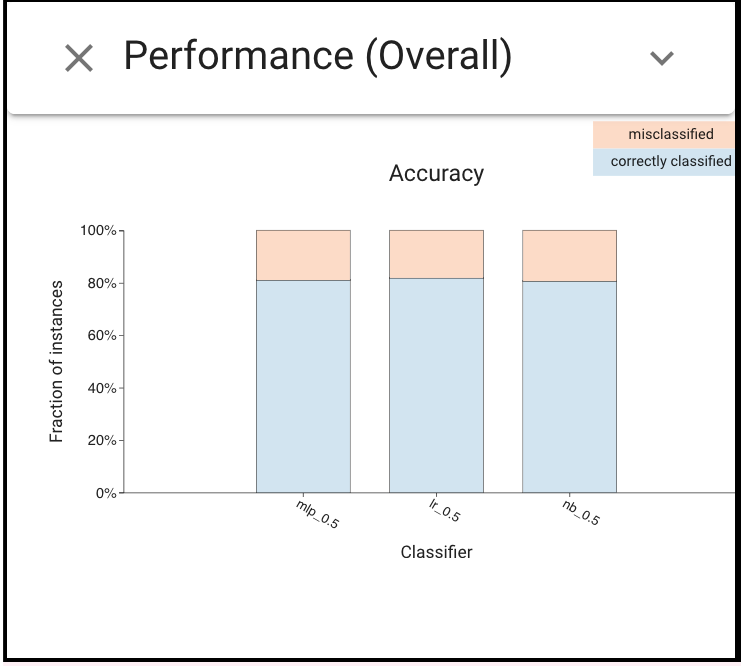
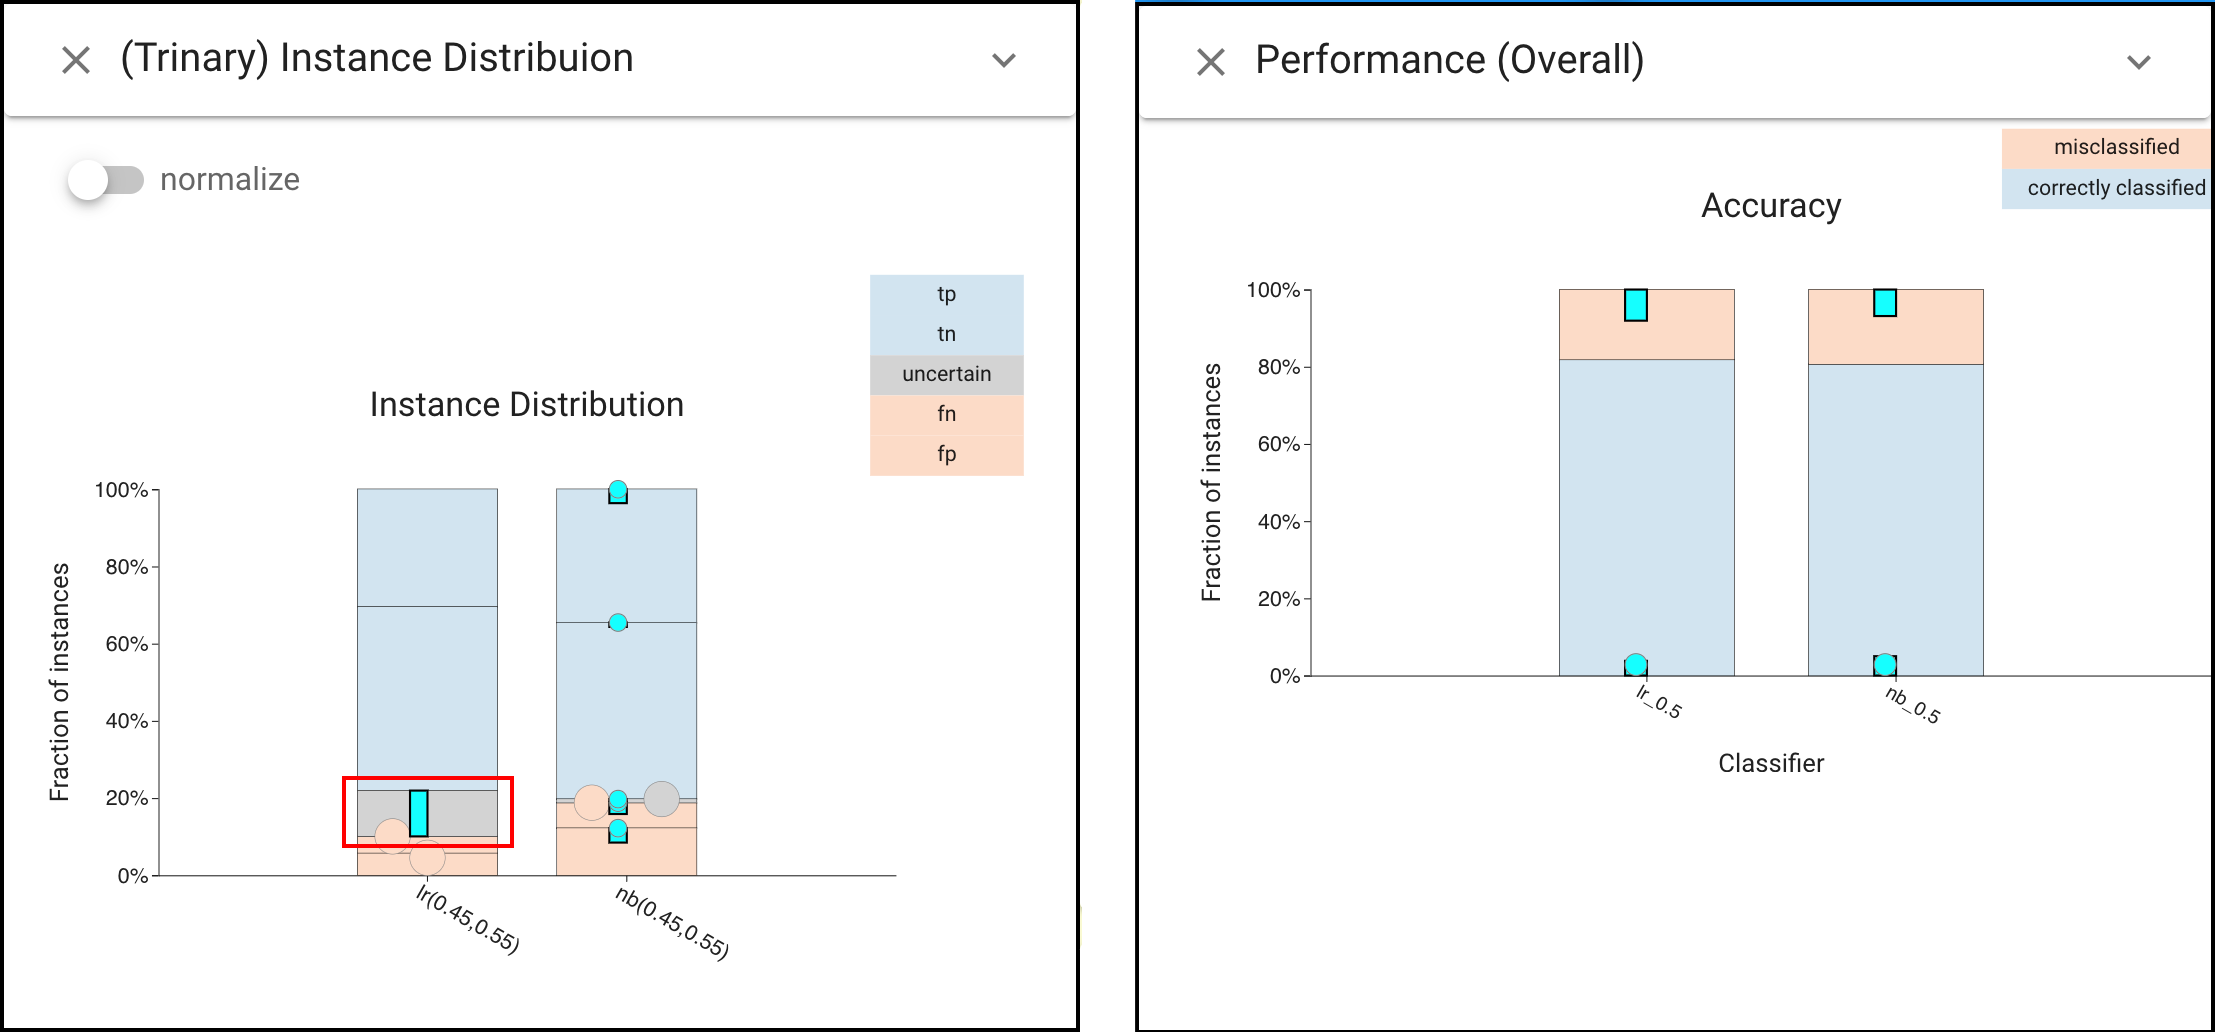
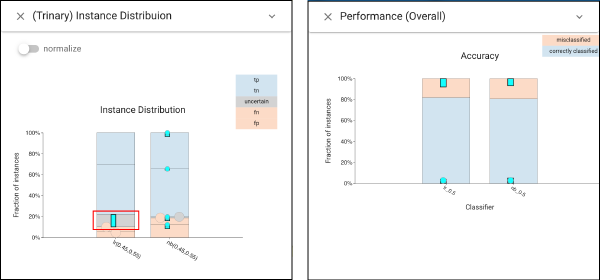
Walkthrough: From Performance Overall view, the 3 models provide very similar correctness summary scores (F1 is .783, identical to 3 decimal places) over a test set of 1500 items.

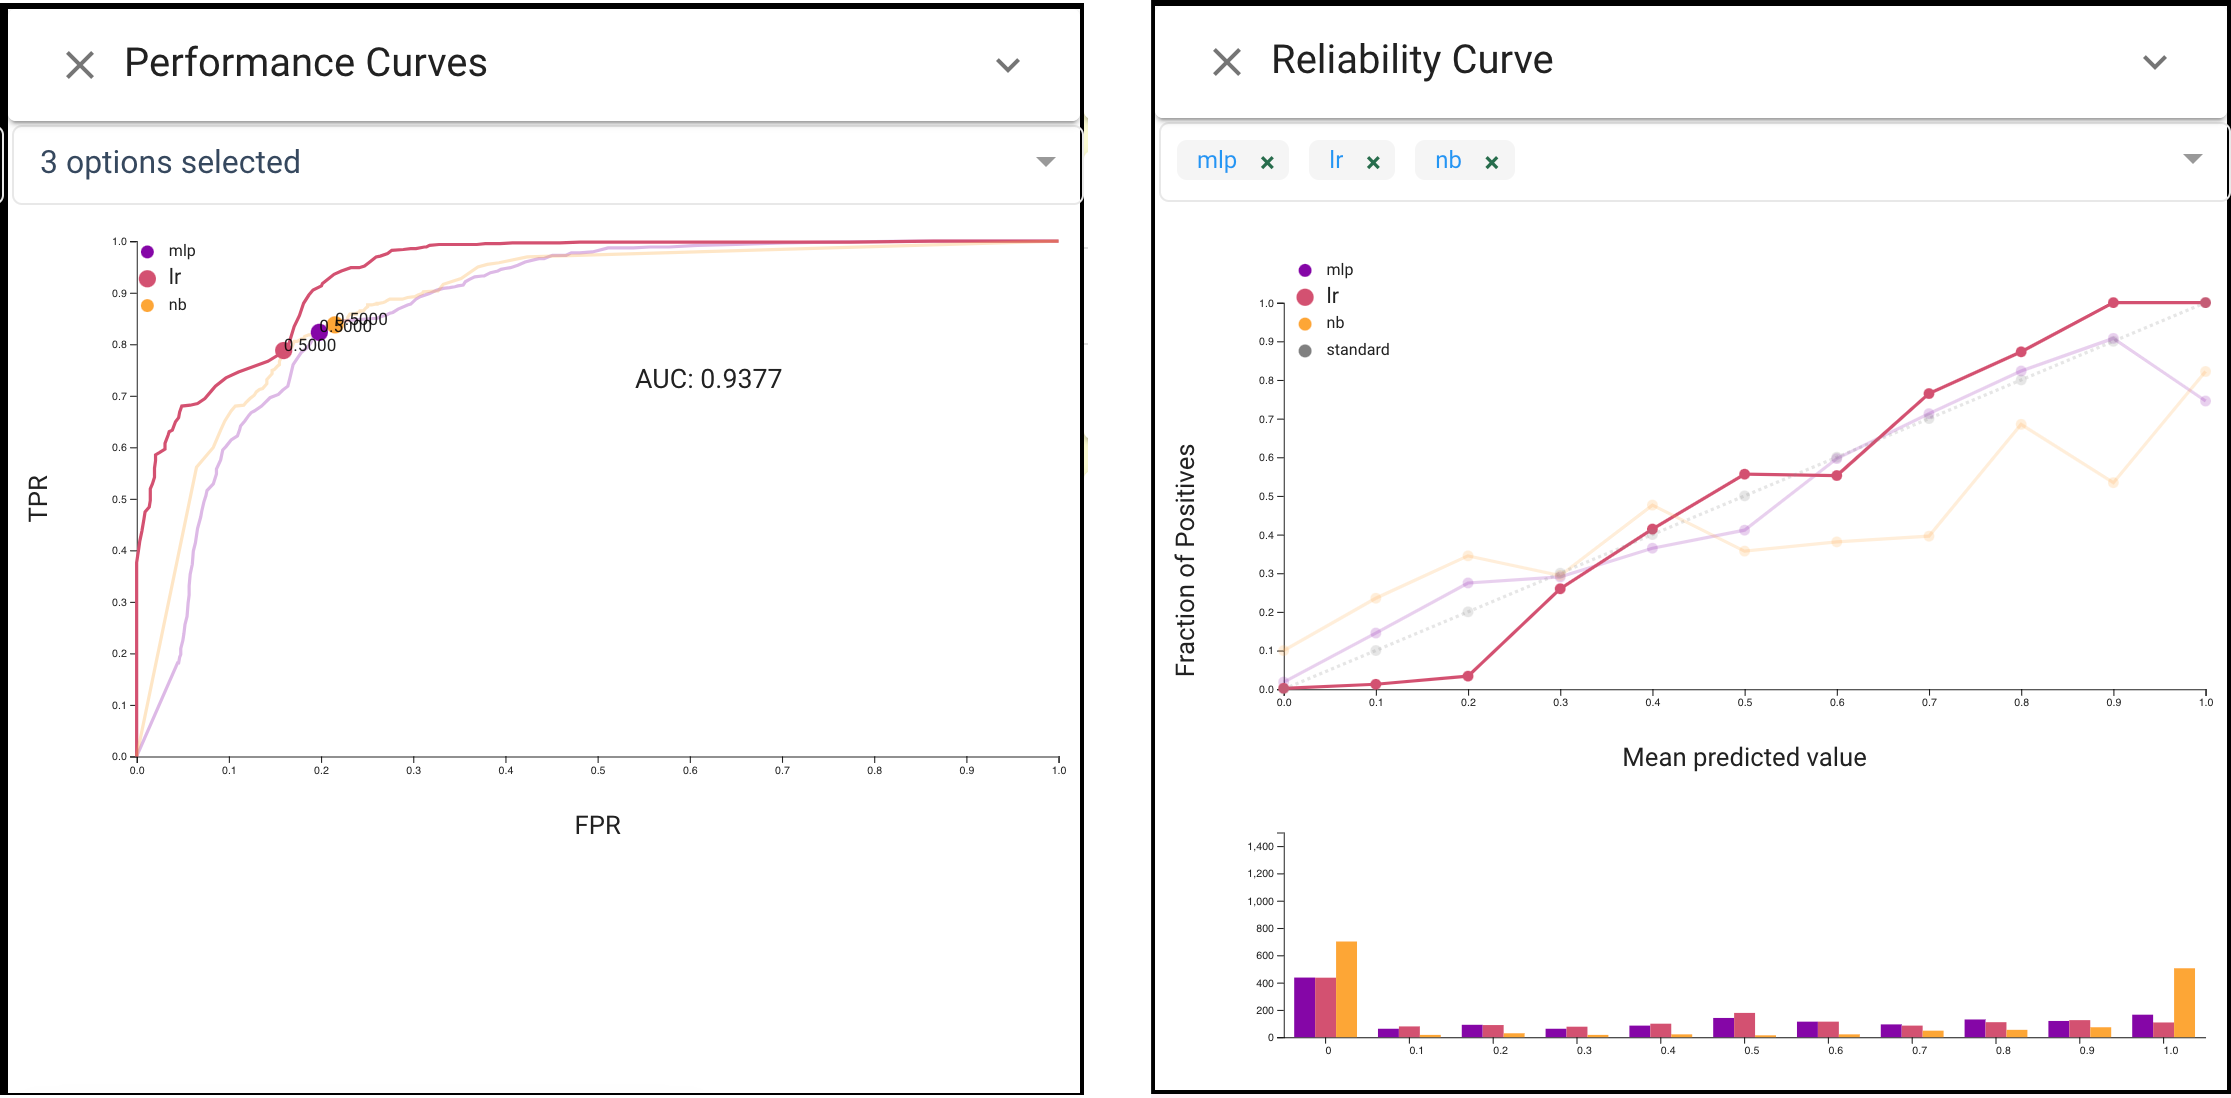
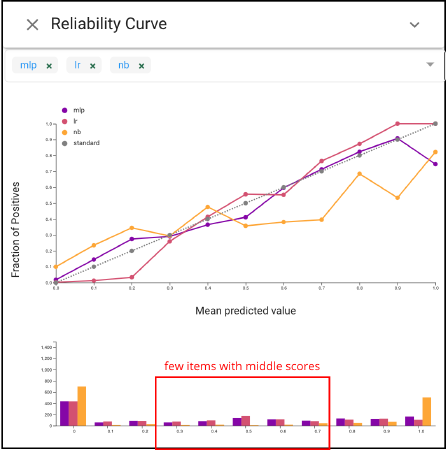
We prefer a calibrated classifier. The AUC score in Performance Curve suggests LR is slightly better, which is confirmed by the Reliability Curve view.
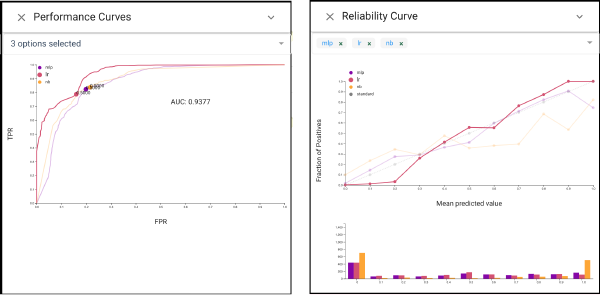
However this view also shows that there are few items with middle scores, so the curve may be unreliable.
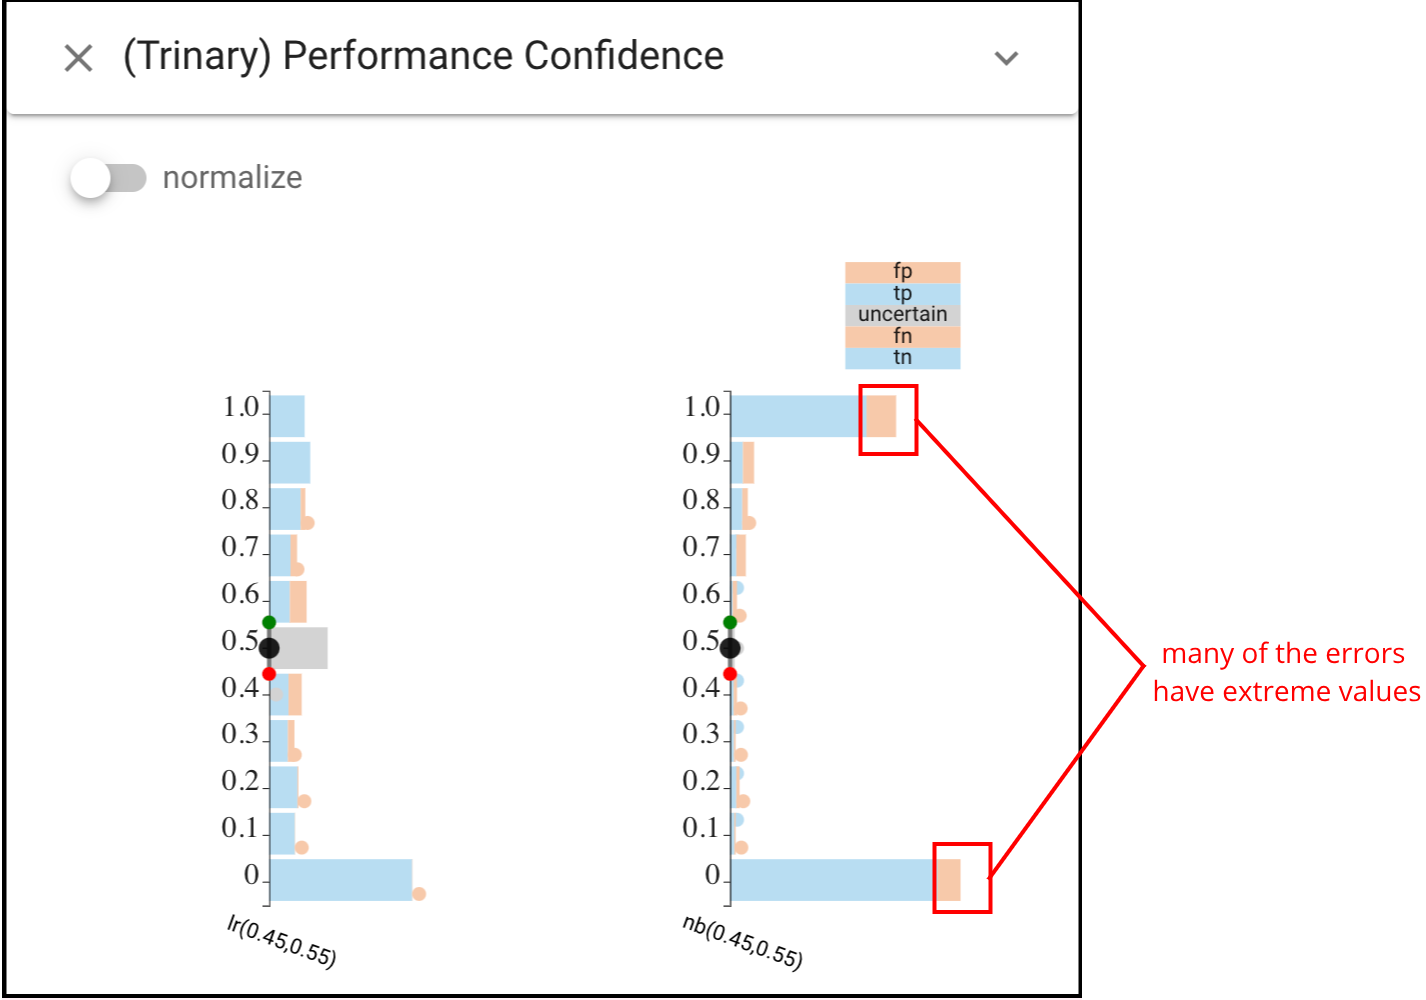
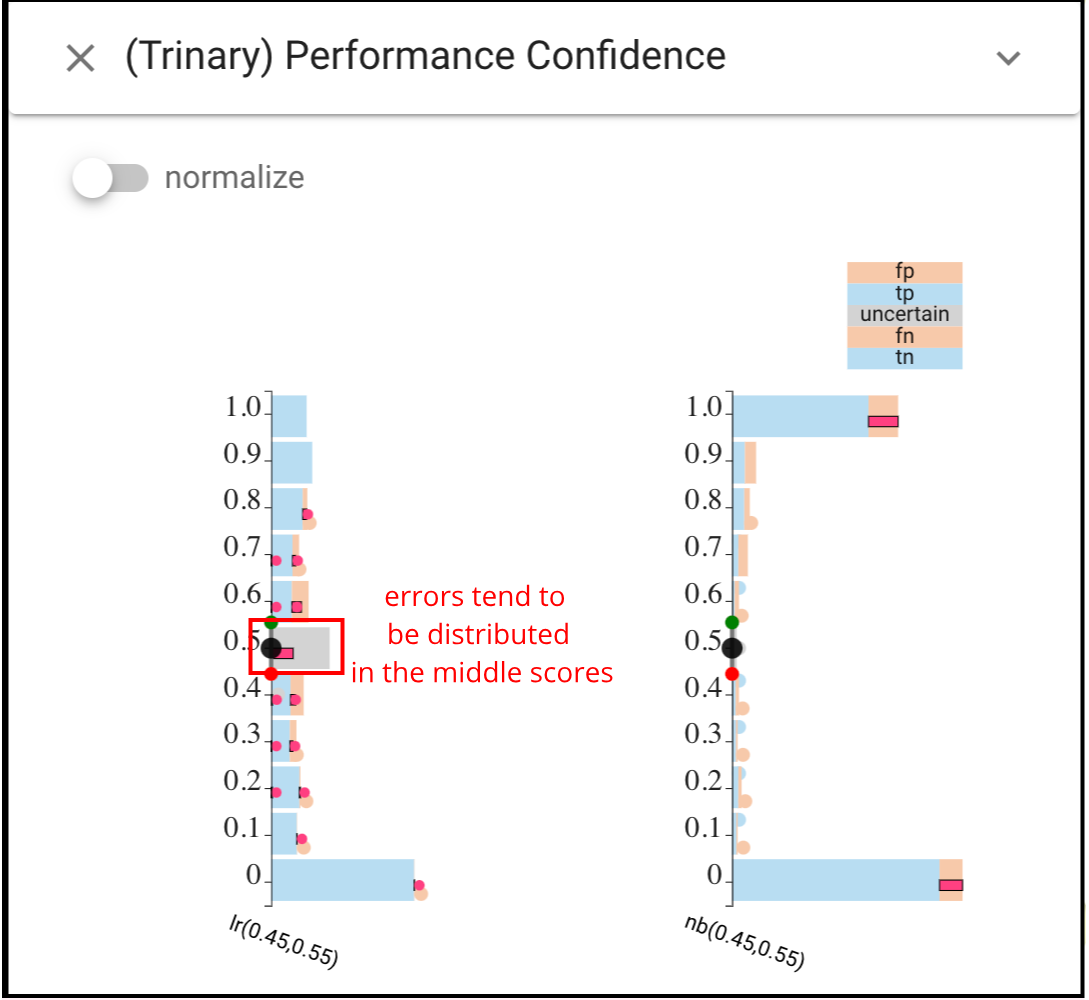
We choose to examine the differences in detail to confirm and explore the differences. The Performance Confidence view shows a clear picture: NB provides a sharp distribution with many extreme values. We see that many of the errors have extreme values.
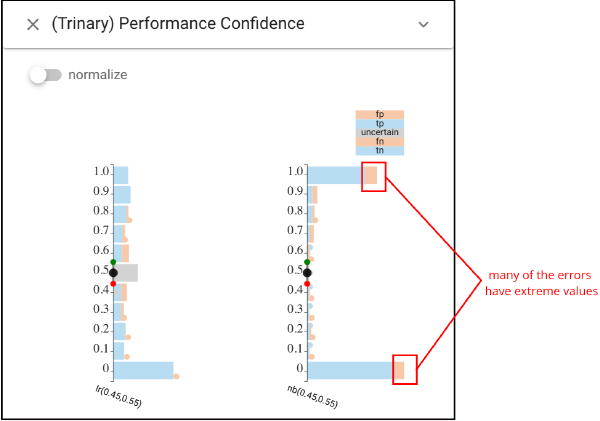
In contrast, LR has many scores in the middle. If we select those intances by using Trinary Instance view, we find many of them are errors as well.
To explore the difference, we select the items that NB has errors and extreme scores by unioning together the error in the highest and lowest bars of the Performance Confidence view. While LR also gets many of these wrong, its errors tend to be distributed in the middle scores.

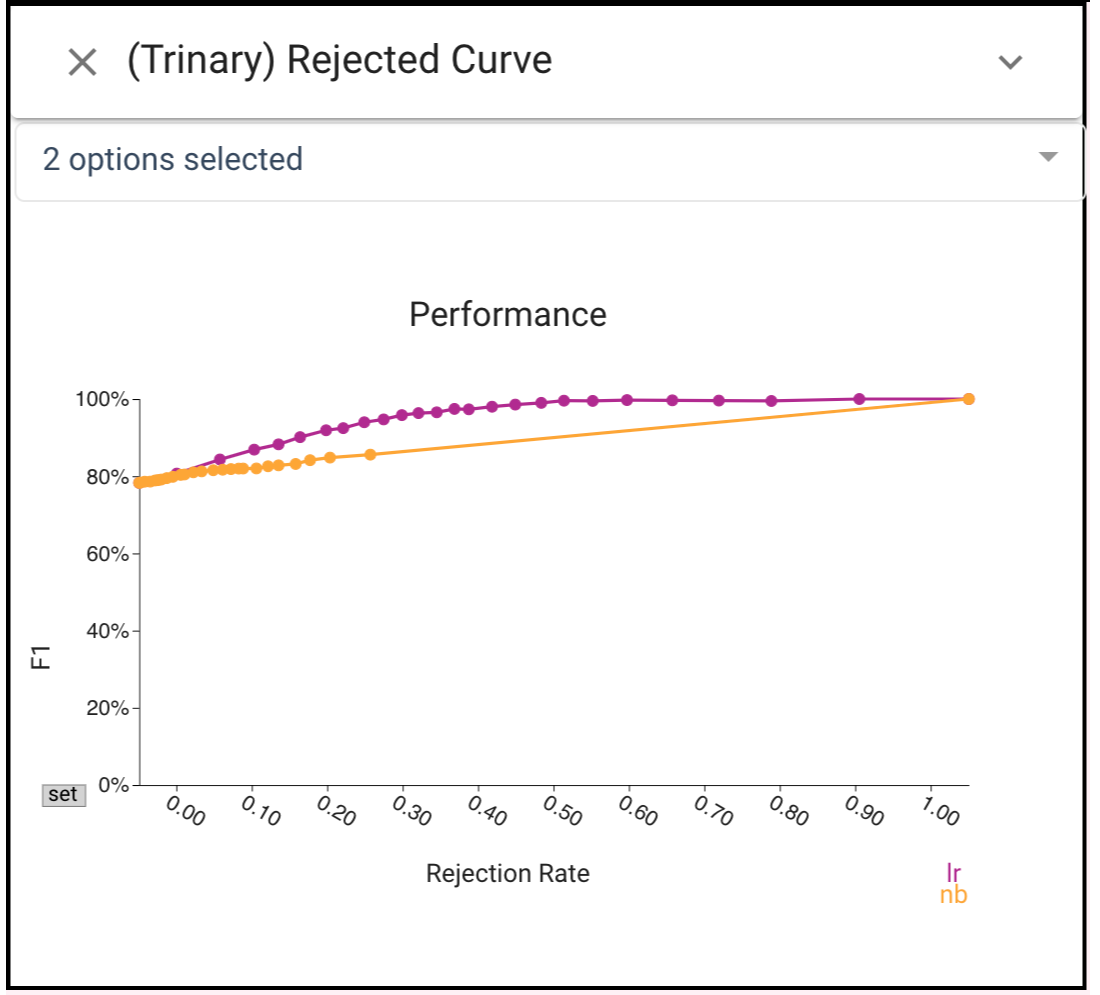
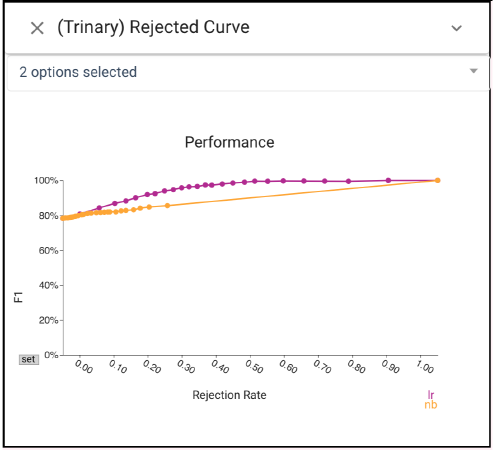
Moreover, if we want to compare performance by considering rejections, Rejection Curve view shows the F1 score of LR raises above.9 when the rejection rate is fixed around 20%, while the F1 for NB is effectively unchanged.
The Uncertainty Heatmap view also show this.
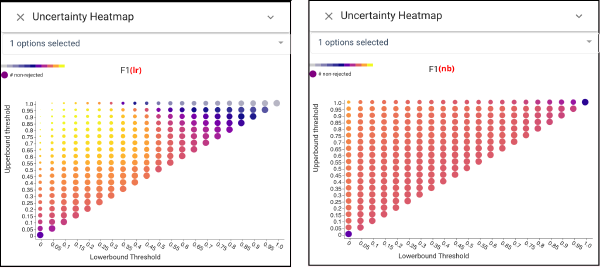
By setting the thresholds of LR between .4 and .6 (we get these two values from the analysis in the Rejection Curve view (Fig. 5C)) and selecting the score values between this range, we see this includes the majority of LR errors.