Dataset: The dataset for this use case is still the TCP collection of historical documents. This use case took a random sample of 12,000 documents, and held out 30% using stratified sampling. While the testing set is balanced (1,800 per class), the training set is highly skewed (only 15% before 1642).
Classifiers: The classifiers have been constructed to determine whether a document is written after 1642 based on the 500 most common words in the corpus. The effective classifiers can help understand how word usage changed at this critical date that marks the beginning of the English Civil War.
Walkthrough:
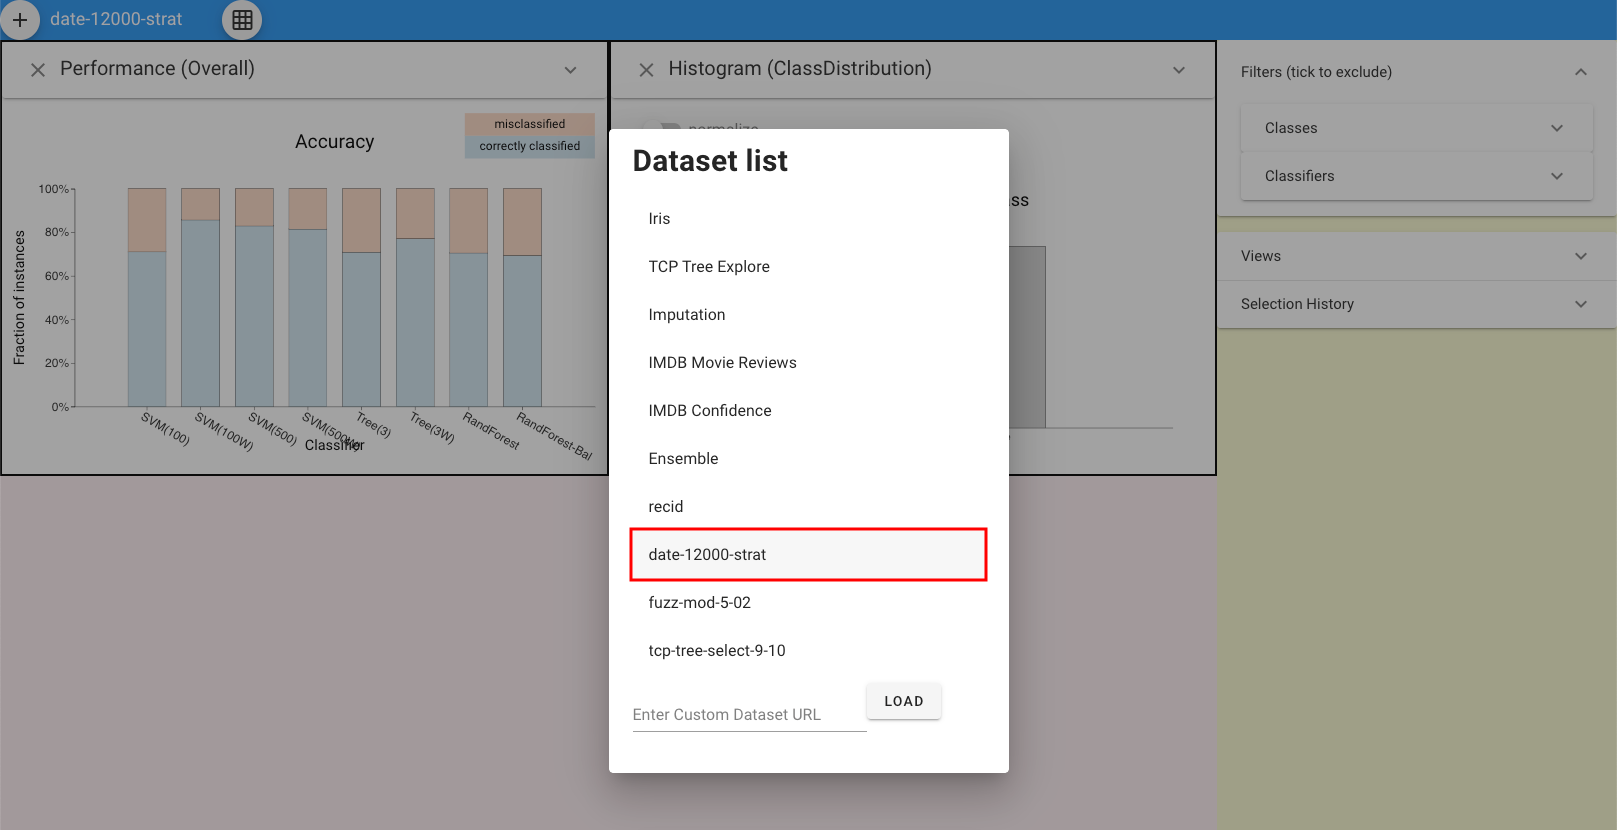
First, click the button on the top left and load the dataset.
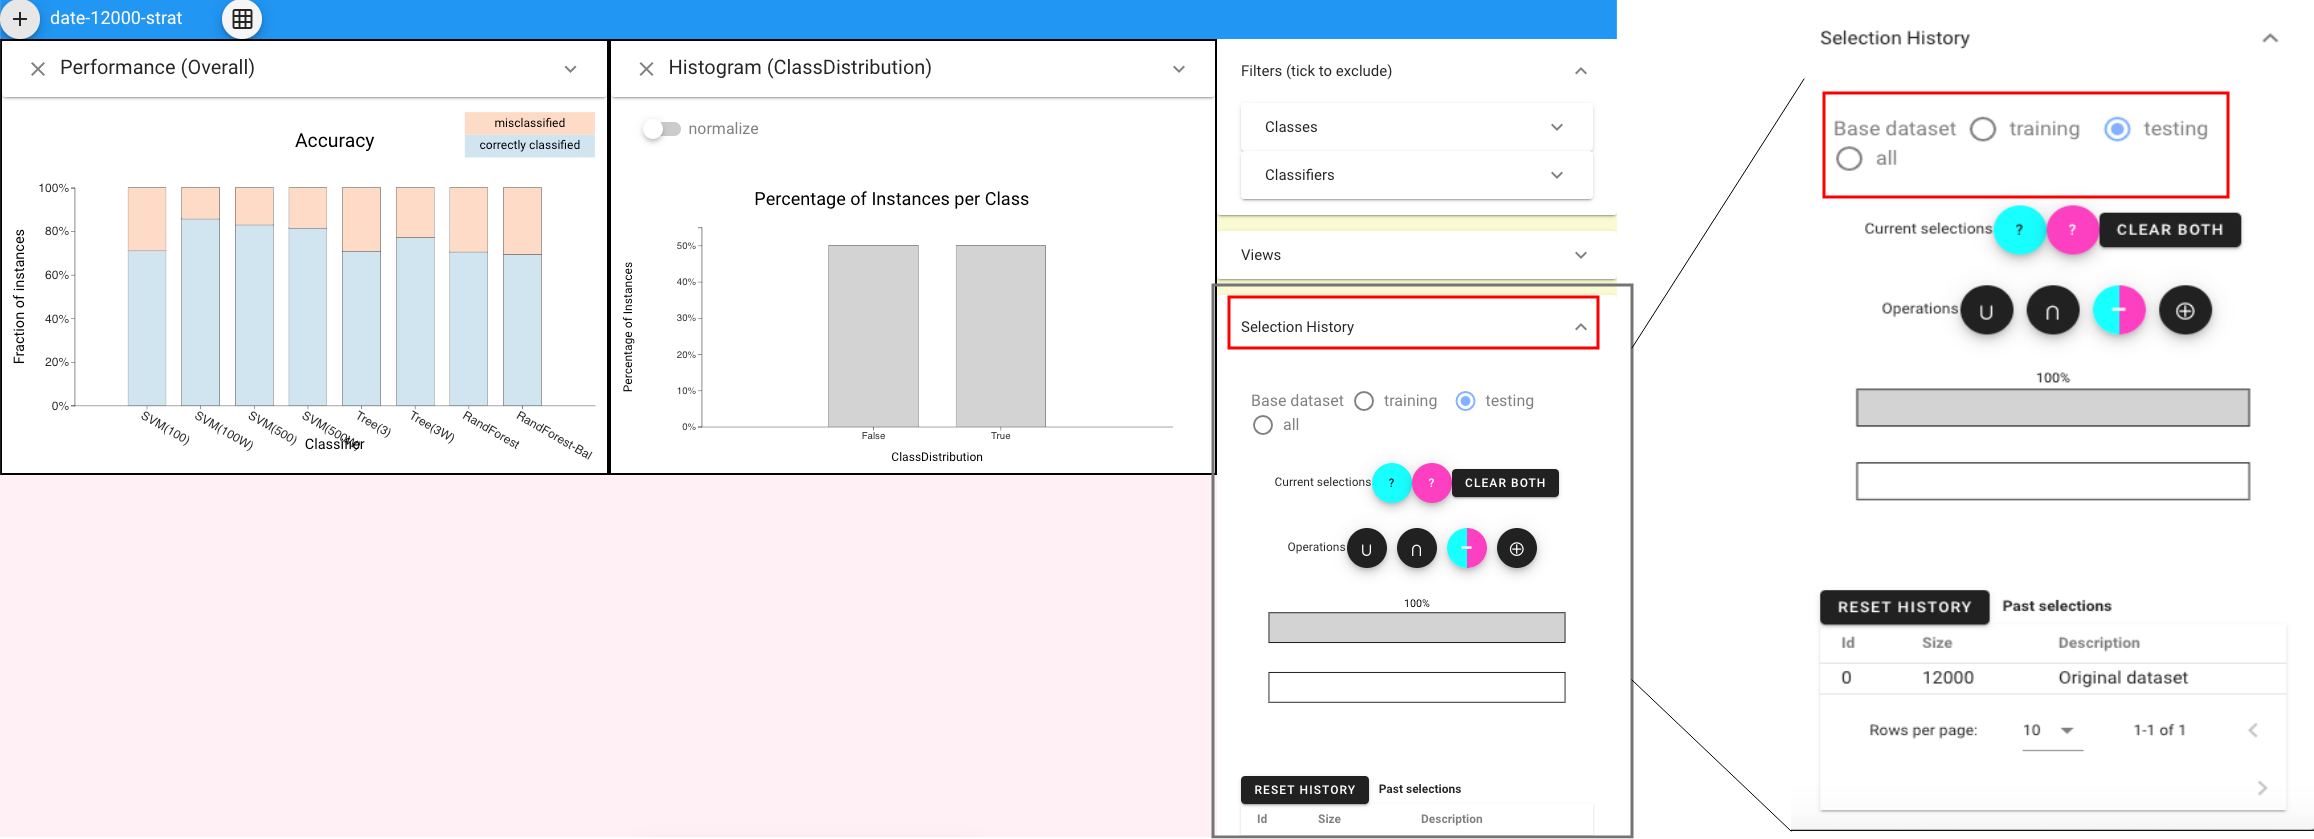
Then, in order to figure out whether bias exists in the dataset, we should explore the performances of classifiers on different datasets by expanding the selection panel at right and choosing either “training” or “testing” dataset.
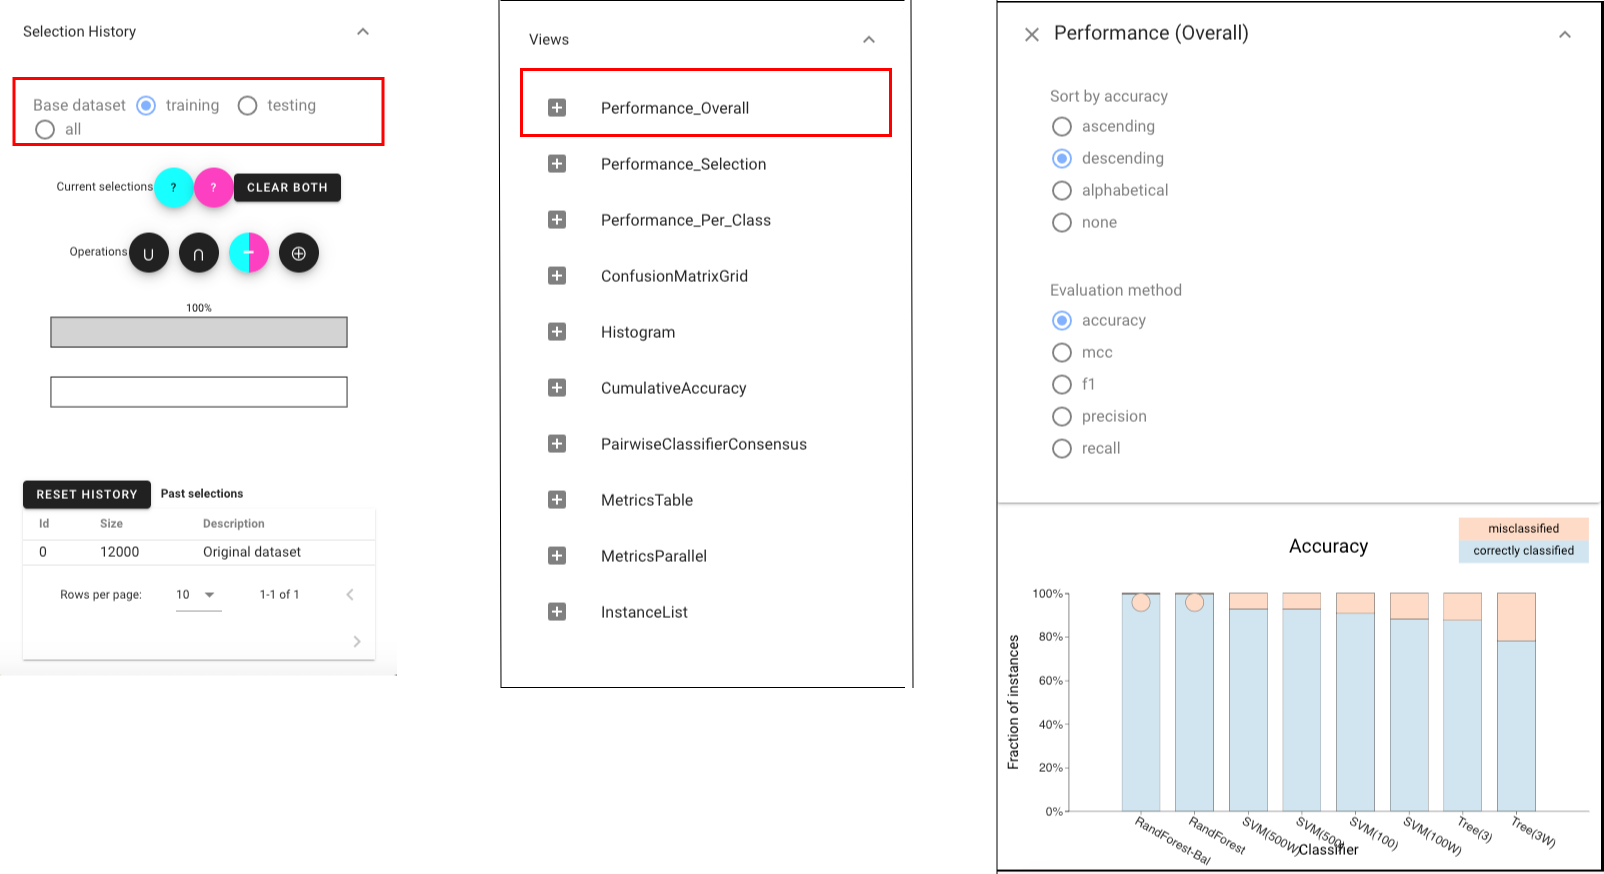
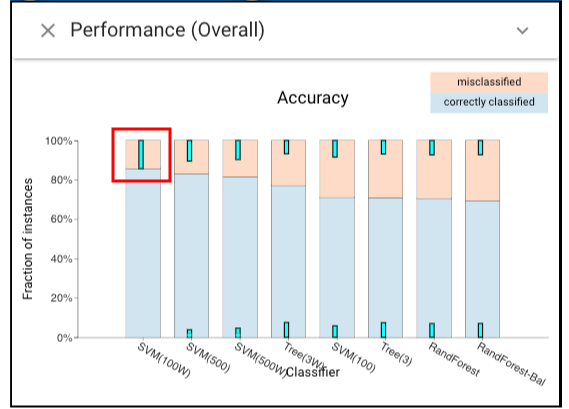
Let’s first look at the performances of each classifier on “training” dataset by choosing the Classifier Performance view.and we can find that several classifiers achieve nearly perfect performance.
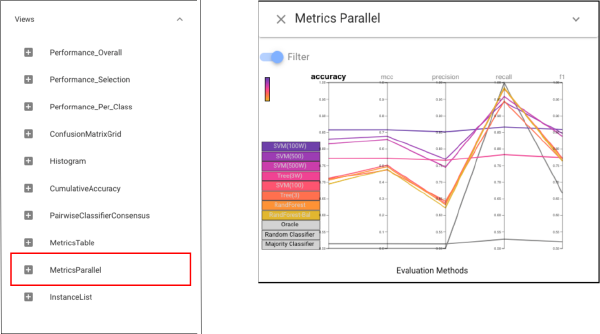
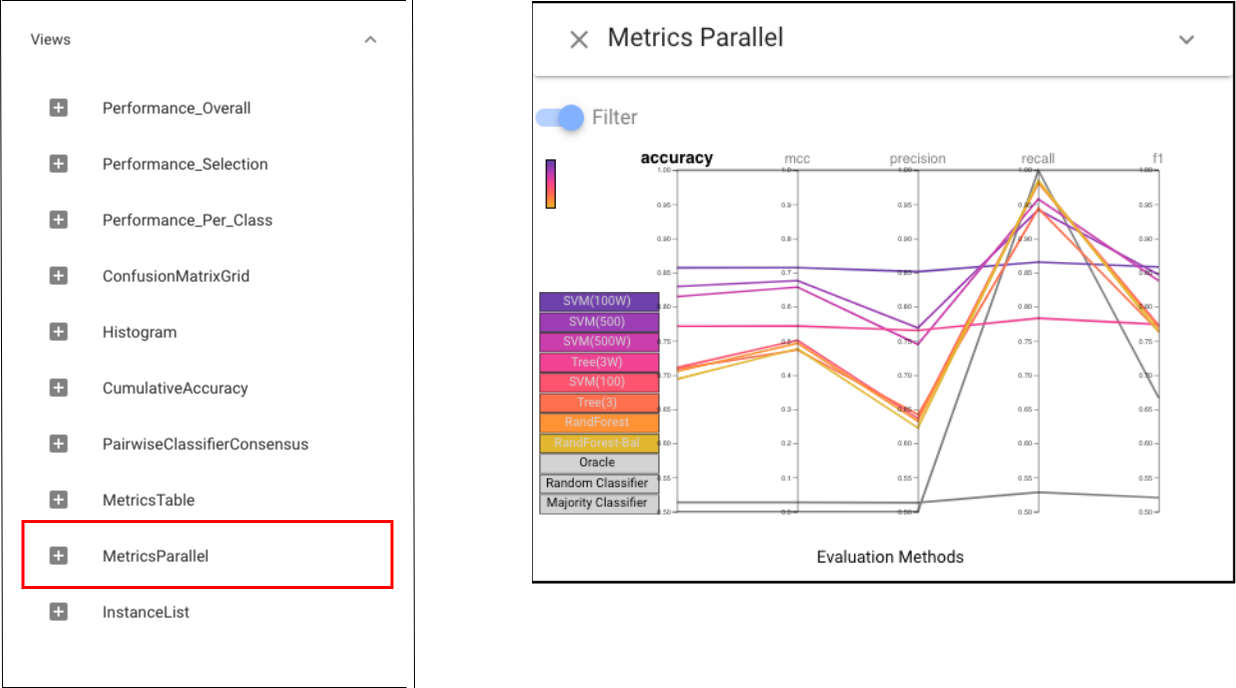
Now, let’s switch to the “testing” dataset to see whether classifiers perform differently on testing set. In order to see performances of each classifier under all evaluation methods, we can choose the Metrics Parallel view. To make it easier to see, we can switch on the “Filter” button to filter the classifiers whose performances are worse than the random classifier, and we can also click the “accuracy” to make sort classifiers by accuracy.On the testing dataset, we see that most classifiers provide high recall but low precision, suggesting that they were unable to successfully account for the class skew in the training set.
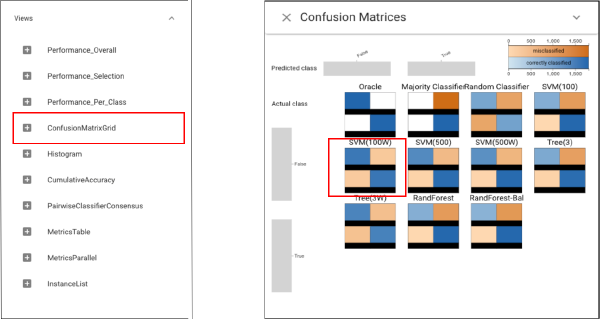
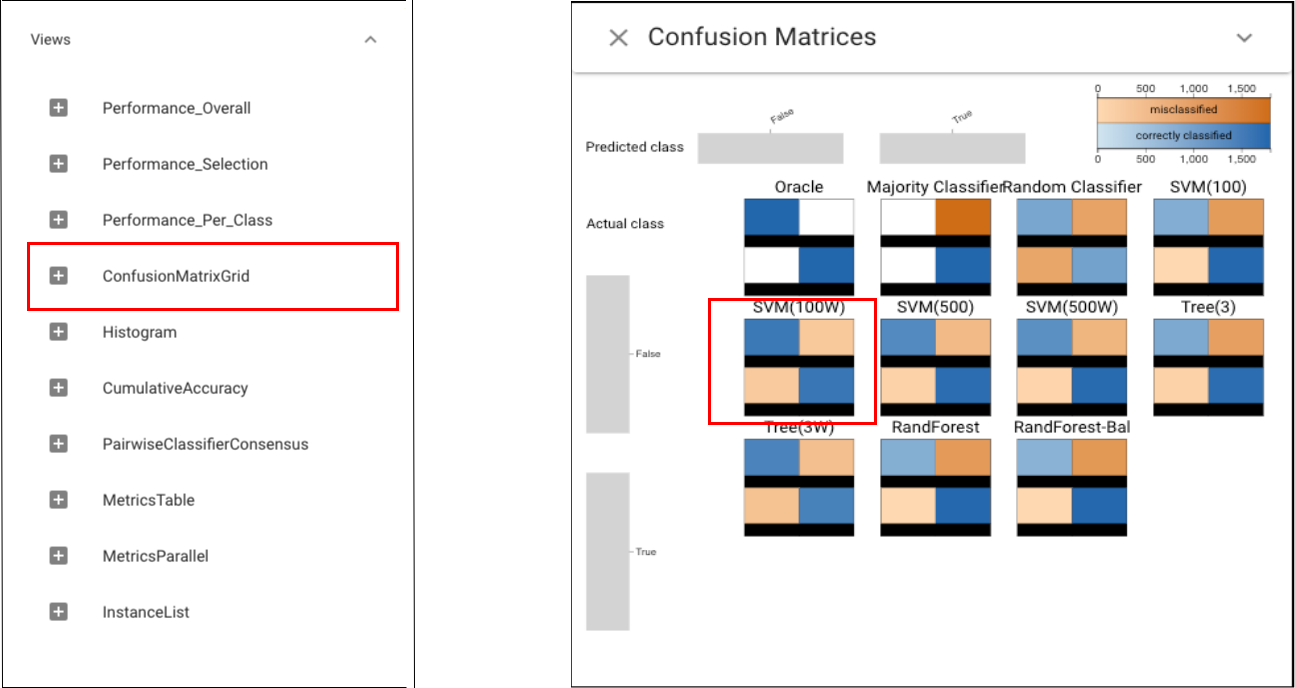
According to the view above, it is obvious to see that the SVM100W (a support vector machine using class weights and more regularization) provides the best performance in all metrics other than recall. Let’s make more detailed analysis by opening the Confusion Matrix grid view and we can tell that it is true that SVM100W can achieve more balanced performance.
As we have found the most balanced classifier: SVM100W, the following analysis will be made around this classifier.
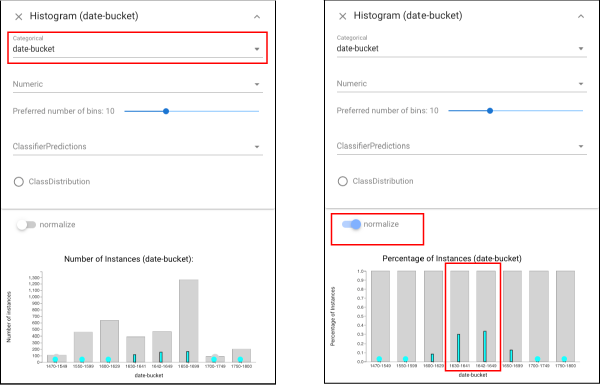
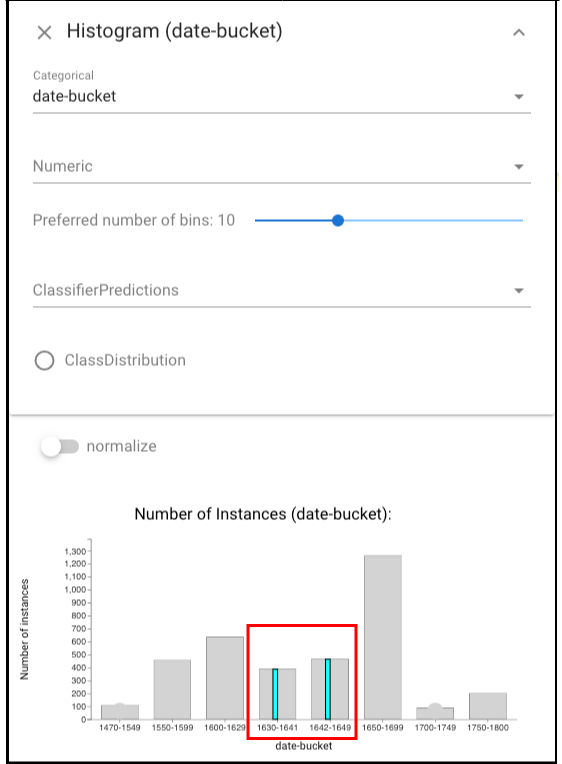
We would expect that performance may be biased near the class boundary, as documents written near the boundary year may be similar to those on the other side (unless there was a dramatic change at the boundary). To check this effect, we select the errors of the classifier:
and then open the Histogram view and see the selection in a histogram of dates (left view). We can also normalize this histogram (to account for the skewed
distribution) and confirm that most errors are in the buckets near the boundary (right view).
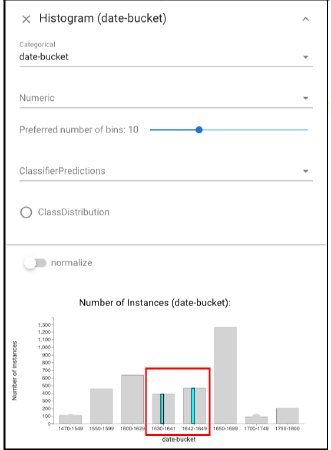
One explanation for the errors may be document length: near the civil war, many short documents were written (e.g., legal decrees). To explore this, we create a subset of documents written near the boundary (“left-click” the instances in “1630-1641” and then “shift + left-click” the instances in “1642-1649”):
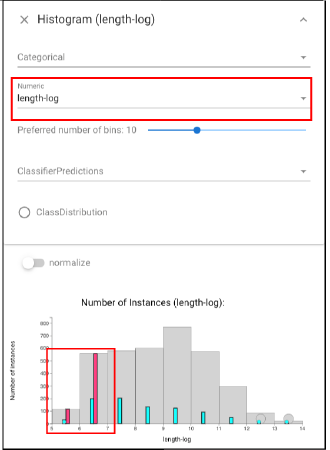
and also select the shortest documents (open another Histogram view, expand the panel above and select the “length-log” in “Numeric” set. Then “right-click” the instances in “5-6” and then “shift + right-click” the instances in “6-7”):
It shows that show that short documents are over-represented in the time period.