
Design Warmup 3: Working with Census Data
The goal of this Design Warmup is to get you working with the (new) census data set that you will use in Design Exercise 3, and to practice two things from this module: choosing appropriate aggregations, and choosing appropriate color scales. You will turn this assignment in on Canvas: Design Warmup 3: Working with Census Data (due Sat, Nov 07). Prepare your answers offline, ahead of time.
There are four visualizations to make (Parts A–D), a list of questions (Part E), and three short questions about how you did the work (Part F).
The data
Use the new census data set, census-composite, described on A Tale of Two Data Sets... (see the Census Data section). Read its README first: it explains the variables, which years each one covers, and how to combine counties. The data comes in several shapes (tall and wide, county and state); pick whichever suits your tools and each question.
You may use whatever tools you like. Maps are allowed for any part but never required: they are easy in some tools and hard in others. The region and division columns give you a geographic grouping without a map.
AI use on this assignment
You may use AI tools to help you, for example to write or debug code, or to walk you through the steps in a tool. You should be the one deciding what the visualizations show and how they show it. Tell us how you used AI in Part F. The course policies allow for a range of AI uses, provided that the use is disclosed. We appreciate clear, specific answers: they help us understand how students are using AI.
A list of examples of recommended (and not recommended) AI uses is coming soon.
For the questions that ask you to explain your design: Name what you did, not a general principle. “I highlighted the Wisconsin counties in orange so they stand out from the rest” is what we’re after; “position is the most accurate channel” isn’t. A few sentences is usually enough; longer isn’t better. Explanations earn credit for what we can see in your chart.
Part A: The Age Make-up of the States
Here is a chart of the number of people 65 and over in each state:
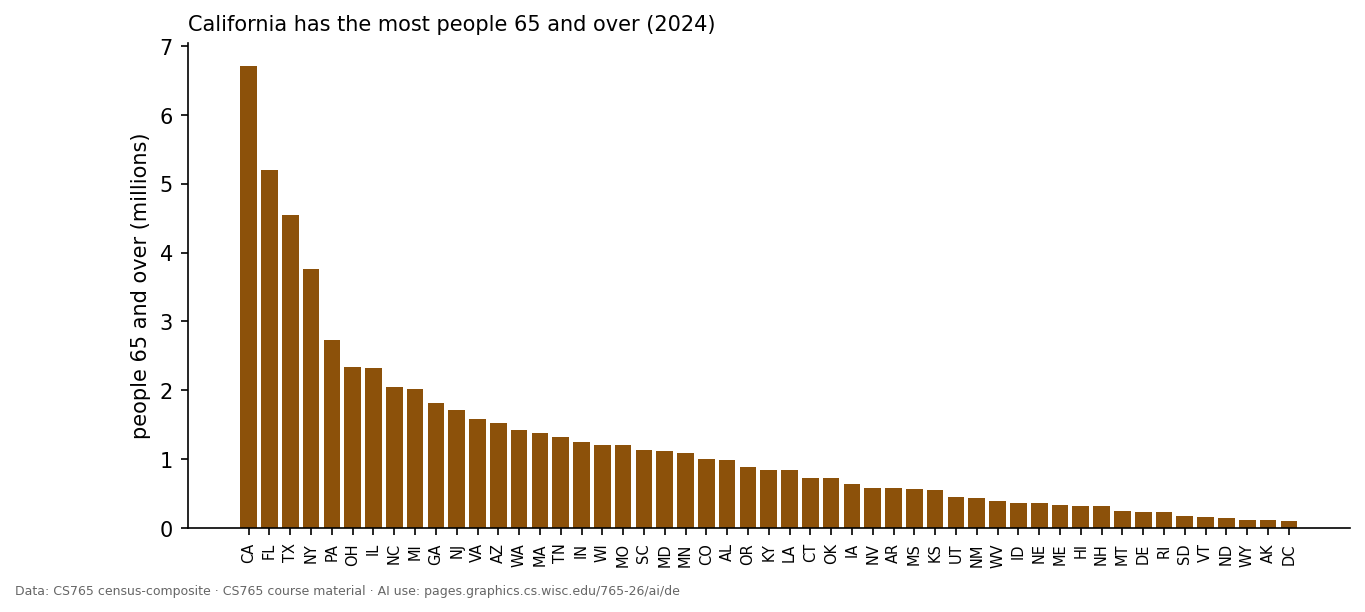
California has the most people 65 and over (2024).
Create a stacked bar chart that avoids the “California is bigger” problem and shows whether its distribution of people across 3 age ranges (under 18, 18 to 64, 65 and over) is similar to other states. Use 2024 (or another recent year).
Question 1: Upload your visualization.
Question 2: What is the main thing your visualization makes easy to see, and what specifically in your design makes it easy? (2–4 sentences)
Part B: How Did the Country Vote?
Here is a chart summarizing presidential elections from 2000 to 2024, using the county data:
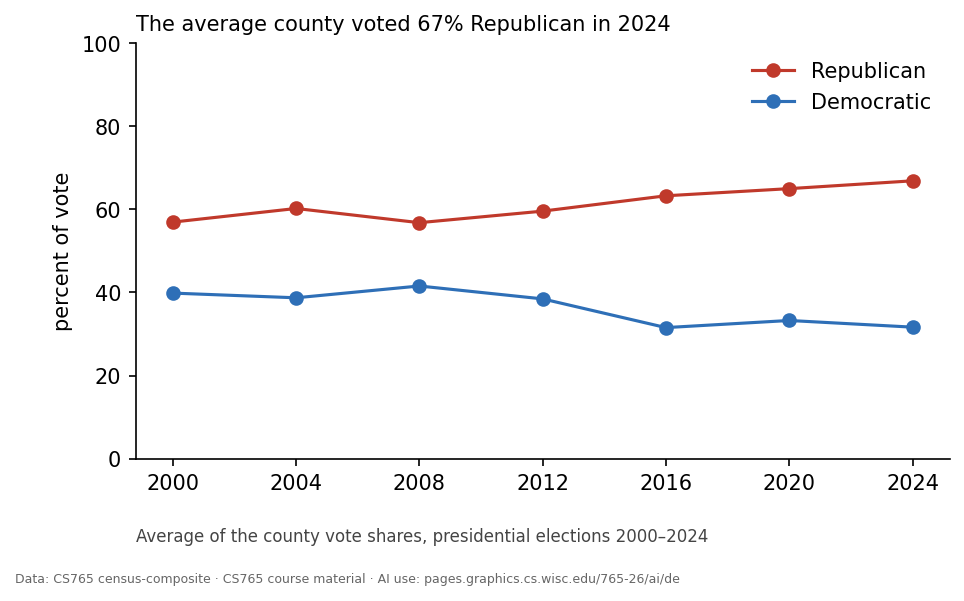
The average county voted 67% Republican in 2024.
This chart shows how the average county voted, which is quite different from how the country voted (counting every voter, which is called “the popular vote”). Create a visualization that shows the popular vote over the years. Try to enable comparisons with the per-county averages. You may simplify to the two main parties (Republican and Democratic).
Question 3: Upload your visualization.
Question 4: What is the main thing your visualization makes easy to see, and what specifically in your design makes it easy? In one sentence, say how you computed the national numbers. (2–4 sentences)
Part C: A Diverging Color Scale
Make a visualization that uses a diverging color scale effectively. You can choose the story, variables, chart type, and even the specific diverging color scale. It just needs to effectively (and correctly) use a diverging color scale.
Question 5: Upload your visualization.
Question 6: Explain how the color scale is used and why it is an effective choice for this data. (2–4 sentences)
Question 7: What is the main thing your visualization makes easy to see, and what specifically in your design makes it easy? (2–4 sentences)
Part D: A Categorical Color Scale
Make a visualization that uses a categorical color scale effectively. You can choose the story, variables, chart type, and even the specific categorical color scale. It just needs to effectively (and correctly) use a categorical color scale.
Question 8: Upload your visualization.
Question 9: Explain how the color scale is used (which variable, which categories) and why it is an effective choice for this data. (2–4 sentences)
Question 10: What is the main thing your visualization makes easy to see, and what specifically in your design makes it easy? (2–4 sentences)
Part E: Questions for the Data
This part is to get you exploring what’s in the data set before Design Exercise 3. Look through the variables in the README.
Question 11: List 5 questions about this data that could (1) be answered by the data and (2) be answered with a visualization. Each question should be a sentence; after each, name the variables (columns) it would use. Try to use different variables across your five questions. Please provide it as a numbered list.
Part F: How You Did It
Question 12: How did you make your visualizations? What produced your final images? (For example “Tableau”, “my own Python with Matplotlib”, or “Matplotlib code Claude wrote from my description”.) If you changed the data beyond loading it, say how in a sentence. (1–2 sentences)
Question 13: How did you use AI on this assignment? Which questions did it touch, and what did it do? (For example: wrote or debugged code, gave step-by-step help in a tool like Tableau, suggested designs or color scales, explored the data, looked things up, drafted or polished text, critiqued your work.) Who chose the designs? Describe how you worked with it, and include two or three prompts that show it, copied as you typed them, including the one that did the most. A full log or share link is welcome but not required. If you didn’t use AI, say so. (The course policies allow for a range of AI uses, provided that the use is disclosed. We appreciate clear, specific answers: they help us understand how students are using AI.)
Question 14: Something that didn’t go as planned. Pick one and describe it in a few sentences: (a) a design you tried and dropped, and why; (b) something in the data that surprised you or that you had to fix; (c) a choice you went back and forth on; or (d) something an AI gave you that was wrong or misleading, and how you noticed. (Answers are not graded on quality.)
How this is graded
This warmup is graded to reward work that is complete and correct, not polished. The questions are designed so that it’s reasonable to do well, and hard to excel.
Parts A–E are each scored as one item:
- 3: complete and correct. The visualization does what was asked, the data is aggregated correctly, the color scale fits the data, and your explanation matches what we can see in the chart. This is the expected score for solid work.
- 4: notable. Something that clearly makes the item better, beyond what was asked (for example, a design choice that makes the key comparison noticeably easier). This is not for polish alone.
- 2 or lower: part of the item is missing, or there is a specific problem (for example, an aggregation that answers a different question than the one asked, or a color scale that doesn’t fit the data).
A submission that is complete and correct on every part earns about a 90 (a borderline A). Going beyond that adds a little, but not much: a simple, correct chart scores about the same as a highly polished one. Once you’ve done what the assignment asks, more effort doesn’t help your grade much (although we hope it helps your learning!).
Part F is required. Insufficient answers may lose points; good answers, or interesting observations, may earn a small bonus.
Your feedback will use codes, as in the design exercises: short labels for things we noticed (good or bad), so the same observation gets the same name for everyone.
CS765 course material · AI use: pages.graphics.cs.wisc.edu/765-26/ai/de