Design Exercise 6: Arrivals
Unfortunately, we didn’t get to the later parts of the Arrivals design exercise in class. So we’ll try to do it as an out-of-class assignment.
The arrivals exercise is designed to help motivate and give practice with the frameworks for comparison. It will be turned in as a canvas quiz: DE06: Assignments (Arrivals) (due Tue, Oct 25). The Canvas Quiz will give you a point for completing the assignment. We will grade it separately.
You may find it useful to review what we did say in class by looking at the slides for Lecture 6-1 (06-1-ScaleICE.pdf 2.4mb). If you look past the place where we stopped, you’ll see more slides about this exercise.
The framework for comparison was a required reading, even though we haven’t discussed it in class yet (and might not before the assignment is due). You can think of this assignment as helping to motivate those ideas.
The Problem
We are given a list of arrivals. In class we talked about students coming to class. But here, I will use the example of students turning in discussion assignments.
In “version 1” of the problem (that we discussed in class), we considered a single assignment. We had a list of times when the assignments were turned in, and made visualizations for various tasks.
In part 2 (our focus here, briefly mentioned in class), we consider the problem of multiple assignments. We have the data from 6 online discussions. For each assignment, we have a list of when postings were made (time stamps). For each posting, we know whether it was an initial posting or a reply posting. We’ll first consider how designs work for the current scale (approximately 6-8 assignments, approximately 50 students each with 2-3 posts). But, we’ll also think about how the designs scale to more events (say 200 students and 30 assignments).
In part 3 (which will be part of this exercise), we consider adding additional information. We won’t do Part 3.
How This Works
There will be a Canvas Quiz to turn in your “answers”. Because of how Canvas works, you should prepare your answers off-line and upload them when you are done. DE06: Assignments (Arrivals) (due Tue, Oct 25)
You are asked to sketch some designs. We recommend drawing them on paper and “scanning” them (your phone camera is fine). You can draw digitally (using a drawing program if you prefer). We do not recommend programming your solutions. And, for now, we are not providing any actual data.
We recommend that you sketch many designs, and then select for the specific questions. In class, we would recommend sketching many designs on one piece of paper, and then pointing to the ones you select. For this, you will need to make individual pictures for the designs you are going to discuss.
The “Part 2” (part 1 of this assignment)
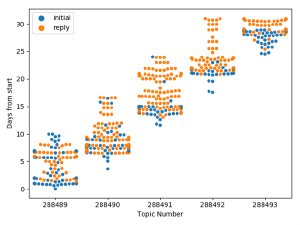
For the half-class scale data, here is a “baseline” solution. It’s a Bee Swarm for each day. Color is used for initial/reply.

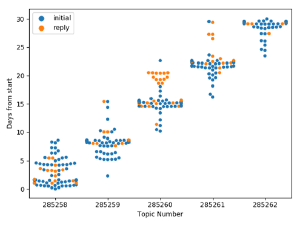
A flaw in this implementation of Bee Swarm: when the swarm goes out of bounds (in this case, it fills the width) points can pile up at the edges. This is (in general) a hard thing to solve with Bee Swarms (many close values). It’s even more obvious in this example (these are seek and finds from 2018):

Of course, your task is to come up with “better” designs. And, by now, you should know that better means in terms of some task (or question that you want to be able to see in the data).
Your designs aren’t for these data sets - it should be for any data set. The baseline is “bee swarms with colors”.
What to do: (1) create a list of tasks; (2) sketch a bunch of designs; (3) pick 2 of those designs and explain why they would be better than the baseline for at least one of the tasks from #1.
The questions (these are the questions on the Canvas Quiz):
List 3-5 (or more, if you like) tasks that you might want to do with the data. Try to think of tasks that benefit from visualization (that can’t just be answered with a number). At least one task should be something the baseline design is effective for.
Upload a file with all of your sketched designs. If they are all on one page, put a picture of the whole page. If they are on multiple pieces of paper, you can make one photograph of the whole set. If they are multiple image files, please put them togetether somehow (as a big image, or a PDF). At worst, you can put them together as a ZIP file (not preferred). This should include the two you choose for the next questions.
Pick one of your designs that you think would be better than the baseline for one (or more) of your tasks. In the question, (1) embed the image (paste the sketch), (2) explain the sketch (if it isn’t obvious), (3) explain a task that you think it would be better at than the baseline, and (4) give your rationale for why.
Pick a different one (than #3) of your designs that you think would be better than the baseline for one (or more) of your tasks. In the question, (1) embed the image (paste the sketch), (2) explain the sketch (if it isn’t obvious), (3) explain a task that you think it would be better at than the baseline, and (4) give your rationale for why.
Briefly, discuss how these three different designs (baseline and your 2 from #3 and #4) will scale with more students. (hint: Bee Swarms won’t do very well)
Briefly, discuss how these three different designs will scale with more assignments.
Note: the designs in 3 and 4 must be different, but they can both excel at the same task.