
ATUS: American Time Usage Survey
The American Time Usage Survey is a big data collection effort from the U.S. BUREAU OF LABOR STATISTICS.
They provide the data files in a very detailed form: data files page
One thing that makes this data interesting is that it is done with a great deal of statistical care to document each thing very carefully so that it can be used correctly.
Another interesting thing… it’s a massive data set that is a familiar enough topic.
You can look at data for a particular year, or for a set across all the years.
Working with this data set can be tricky.
Working with the summary files
The summaries files are the easiest to use (and what we will use).
The ATUS Activity Summary file contains information about the total number of minutes each respondent spent doing each activity. The file also includes selected variables from the ATUS Respondent, ATUS Roster, and ATUS-CPS files.
The “summaries” files consist of a row per “respondent” (person). Each row has:
- A case ID “TUCASEID”
- roughly 24 “metadata” characteristics
- roughly 430 time usages (the number of minutes for each of 430 categories)
To know what the columns mean, you must consult:
- ATUS 2003-2021 Interview Data Dictionary.
- 2003-2021 ATUS-CPS Data Dictionary (PDF) -
- 2003-2021 ATUS Coding Lexicon (PDF) - definitions of time categories
I started to make a table decoding the column names: (codes.xlsx 0.0mb). It has the column names for the summary file (the main one we use), the CPS file (details about people’s households), and the respondents file (more about the responses).
If you’re willing to join against other files, you can get more information for each case ID. This is optional for any of the class assignments.
I downloaded the file “atussum_0321.dat” (inside of a ZIP file with other stuff) on Oct 7, 2022. The file’s creation date is May 4, 2022 (so this is the version I started from). I renamed it to have a CSV extension (since it is actually a CSV file). It is available on Canvas as (atussum_0321.csv 222.8mb).
The file has 228455 rows (people that were surveyed over the years), and 456 columns. It’s a 217MB CSV file.
Yes, if you add up all the 431 time use categories for any person (row) it adds up to 1440 (the number of minutes in a day).
The Time Use Categories
The time usages have 6 digit codes, explained in 2003-2021 ATUS Coding Lexicon (PDF).
The codes form a hierarchy. The first 2 digits are the “top level group” (there are 18), the first 4 digits are the “second level group” (there are 107), and the bottom level uses all 6 digits. So, for example, “18” is “Travel”, codes “1801” to “1899” are different types of travel (code 1805 is “Travel Related to Work”), and then the codes “1805XX” are the 431 specific categories (e.g., code 180502 is “Travel related to work-related activities”). The actual summary file only has the specific categories.
I also made a list of:
Reduced Data Sets
I encourage you to try to work with the complete data sets, but if you want to start with something smaller…
I made some smaller files that are easier to work with.
First, having all 431 specific categories is a bit much (possibly interesting, but hard to work with). I reduced it to the 18 top level categories. The files I made all have named ending in “reduced” since they only have the 18 top level categories (each person still adds up to 1440 minutes, I aggregated the specific categories). The file (atussum_0321-reduced.csv 33.1mb) has all the rows.
I then made a few files that restrict the years:
- (atussum_19-reduced.csv 1.4mb) - just 2019 data
- (atussum_1921-reduced.csv 2.7mb) - just 2019 and 2021 data
- (atussum_1121-reduced.csv 9.3mb) - 2011,2013,2015,2017,2019, and 2021
If you want to see my script, its in (atus22.py 0.0mb). It assumes the files are in the right place.
More Columns
If you want to find out more information about each person, you need to look at the respondents file (I renamed it from .dat to .csv) and join it (using the case id). Tableau will just do this for you (load in both files and drag them both into the workspace to connect them).
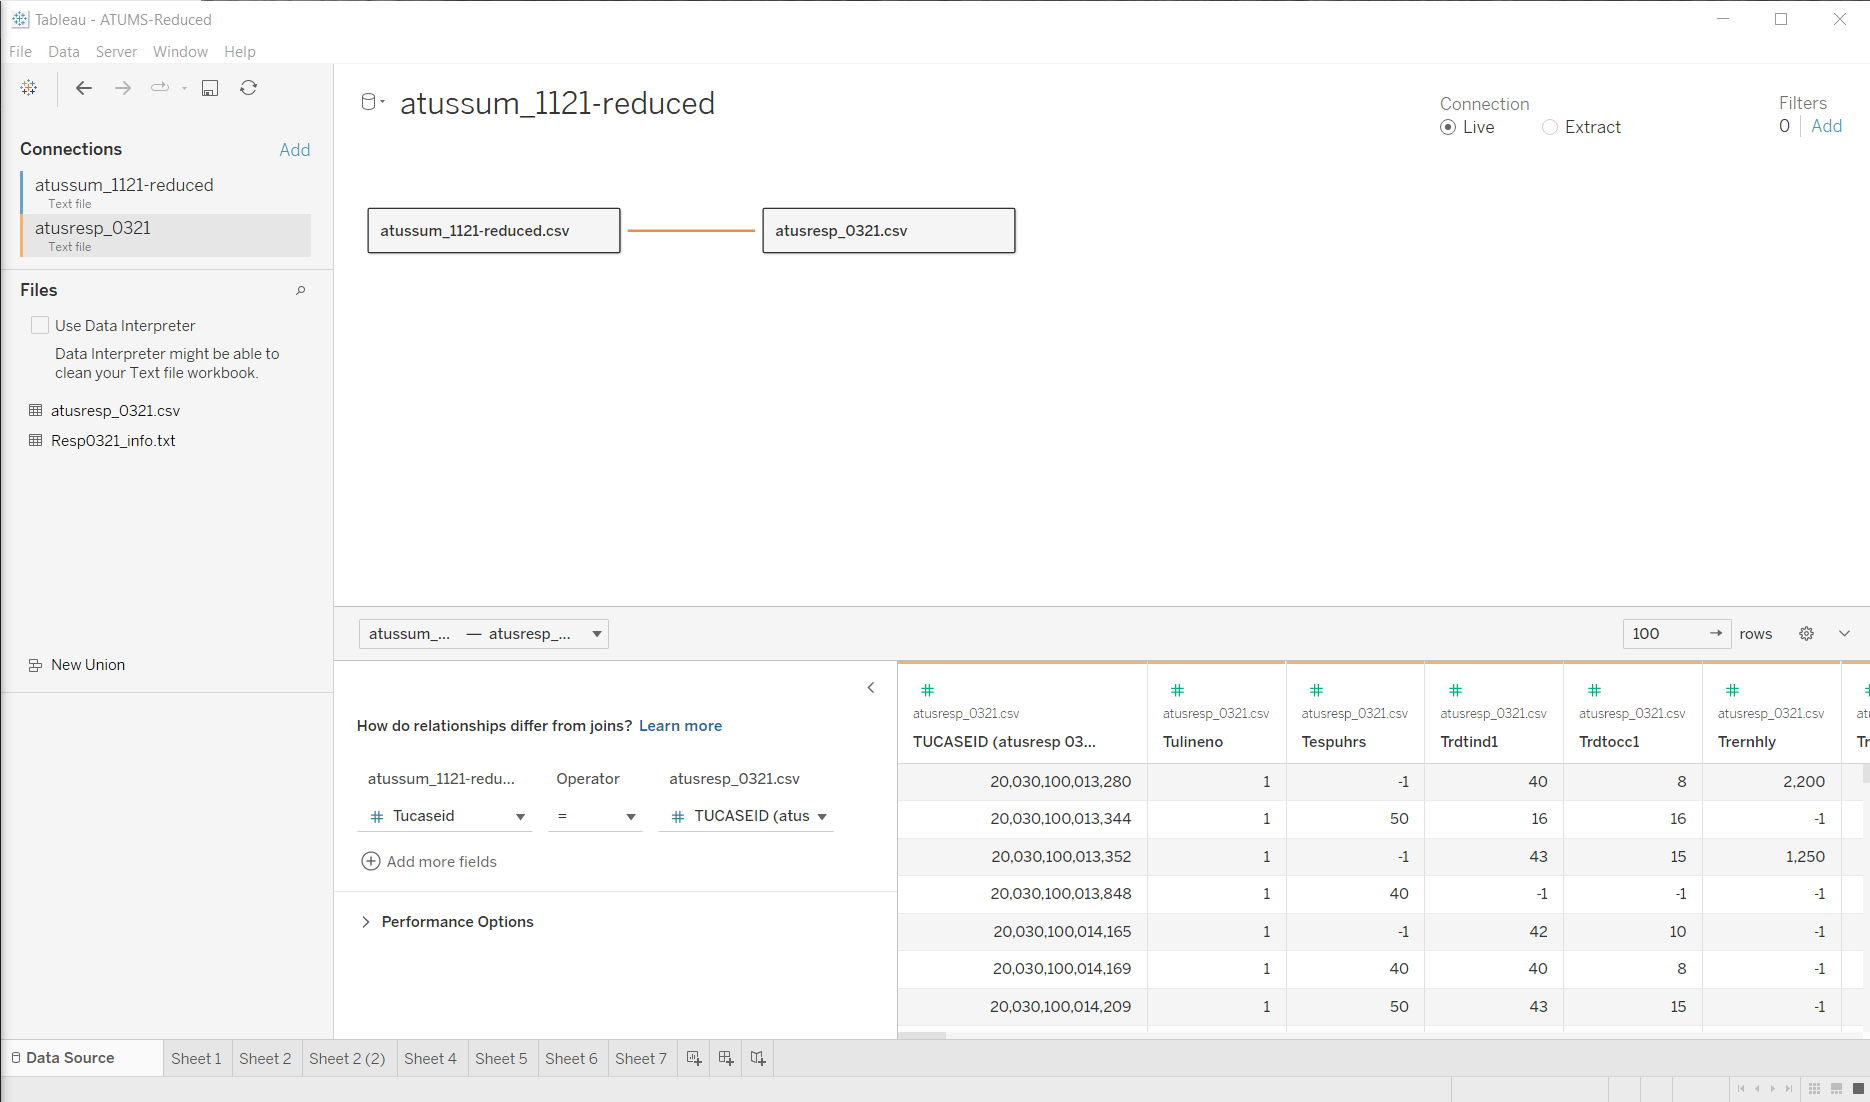
The tricky part is that the responses file has many columns - and you need to figure out which ones are useful. This is basically more detail about how people spend their time (like amount of time spent along). The columns are documented in the ATUS 2003-2021 Interview Data Dictionary.
There is also the “CPS” file - which has information about the households. This has a lot of useful information about each person like “geographic” region. This file is MUCH harder to use. In part because it is huge (in terms of rows and columns). The CSV file is almost a gigabyte. It has 1332590 rows - since it covers person in the household of every respondent. It has 252 columns because, well, they record a lot of data about each person.
And yes, Tableau will happily just read this in. It deals with big files very quickly. And it performs the join. Amazingly quickly.
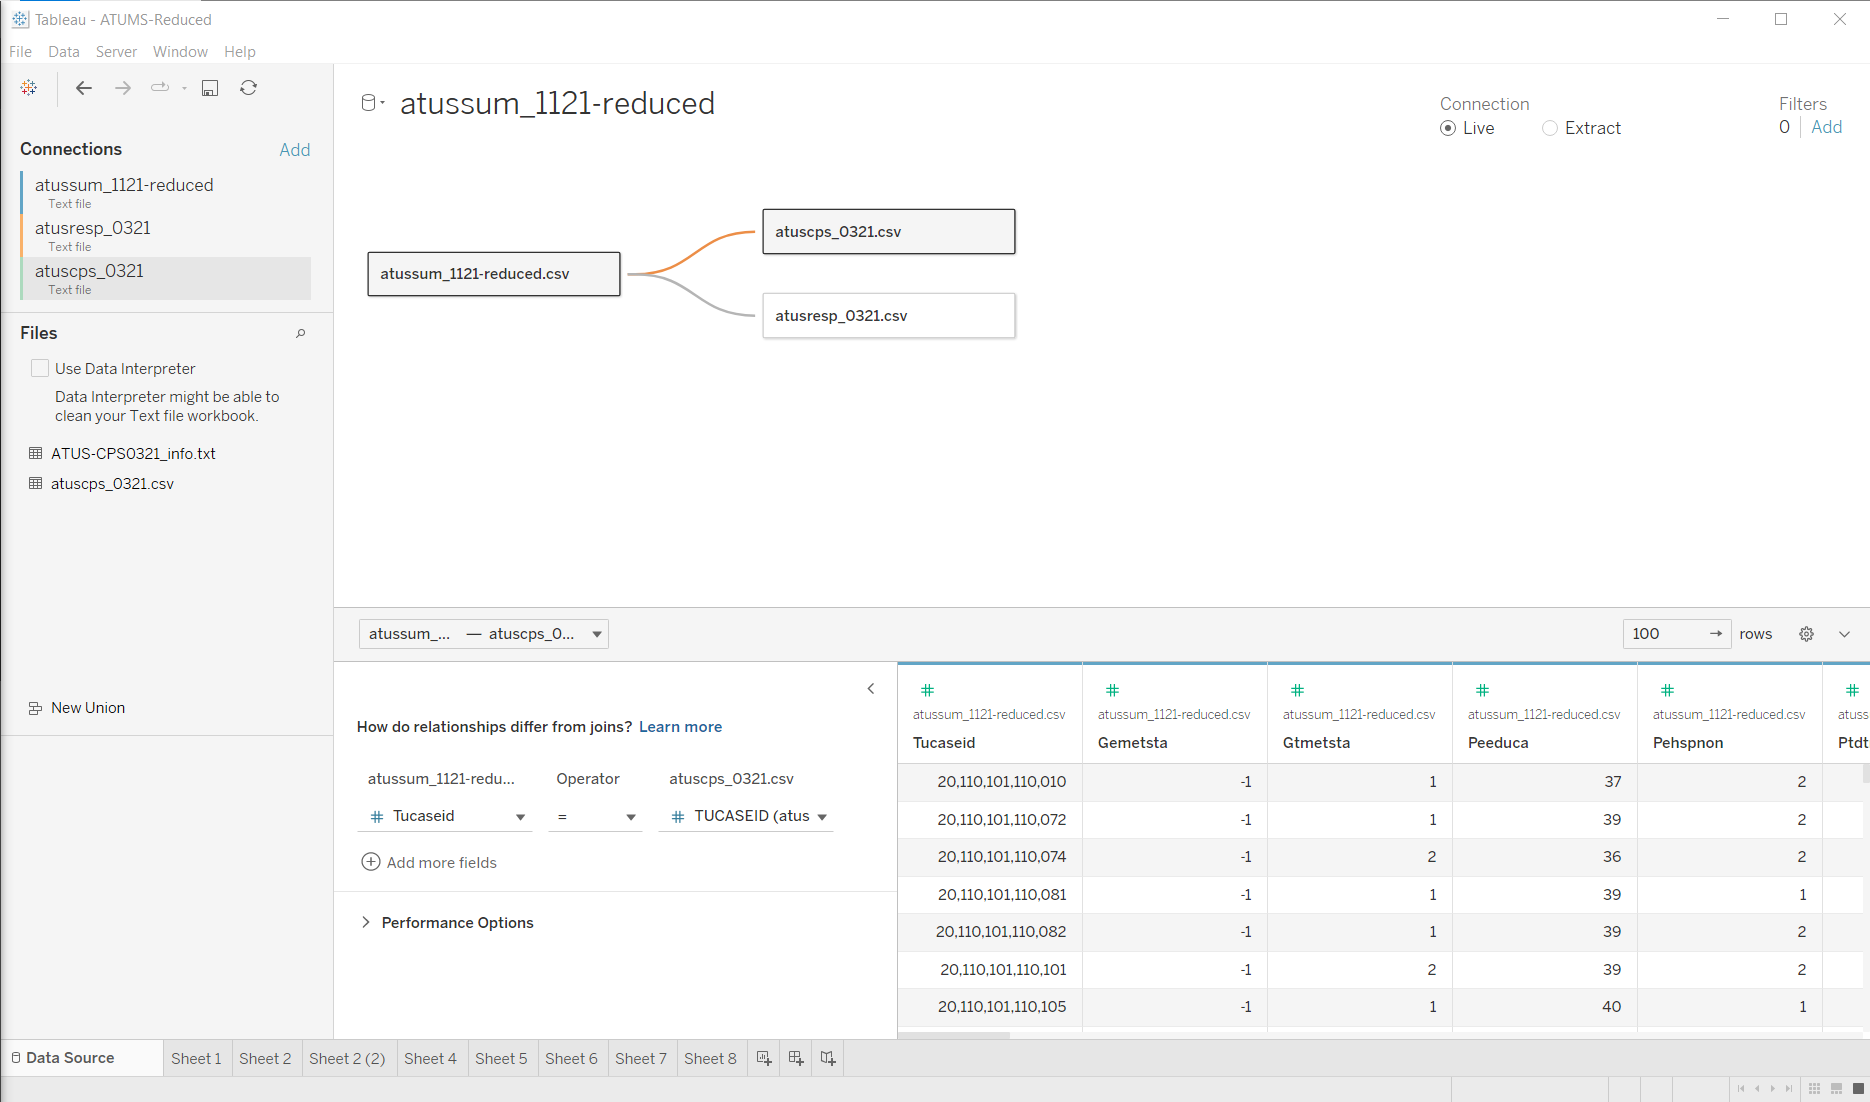
What is in those 252 columns? Well, looking in 2003-2021 ATUS-CPS Data Dictionary (PDF) I see “GEREG” - the “region”, clearly interesting. Let me try it out…
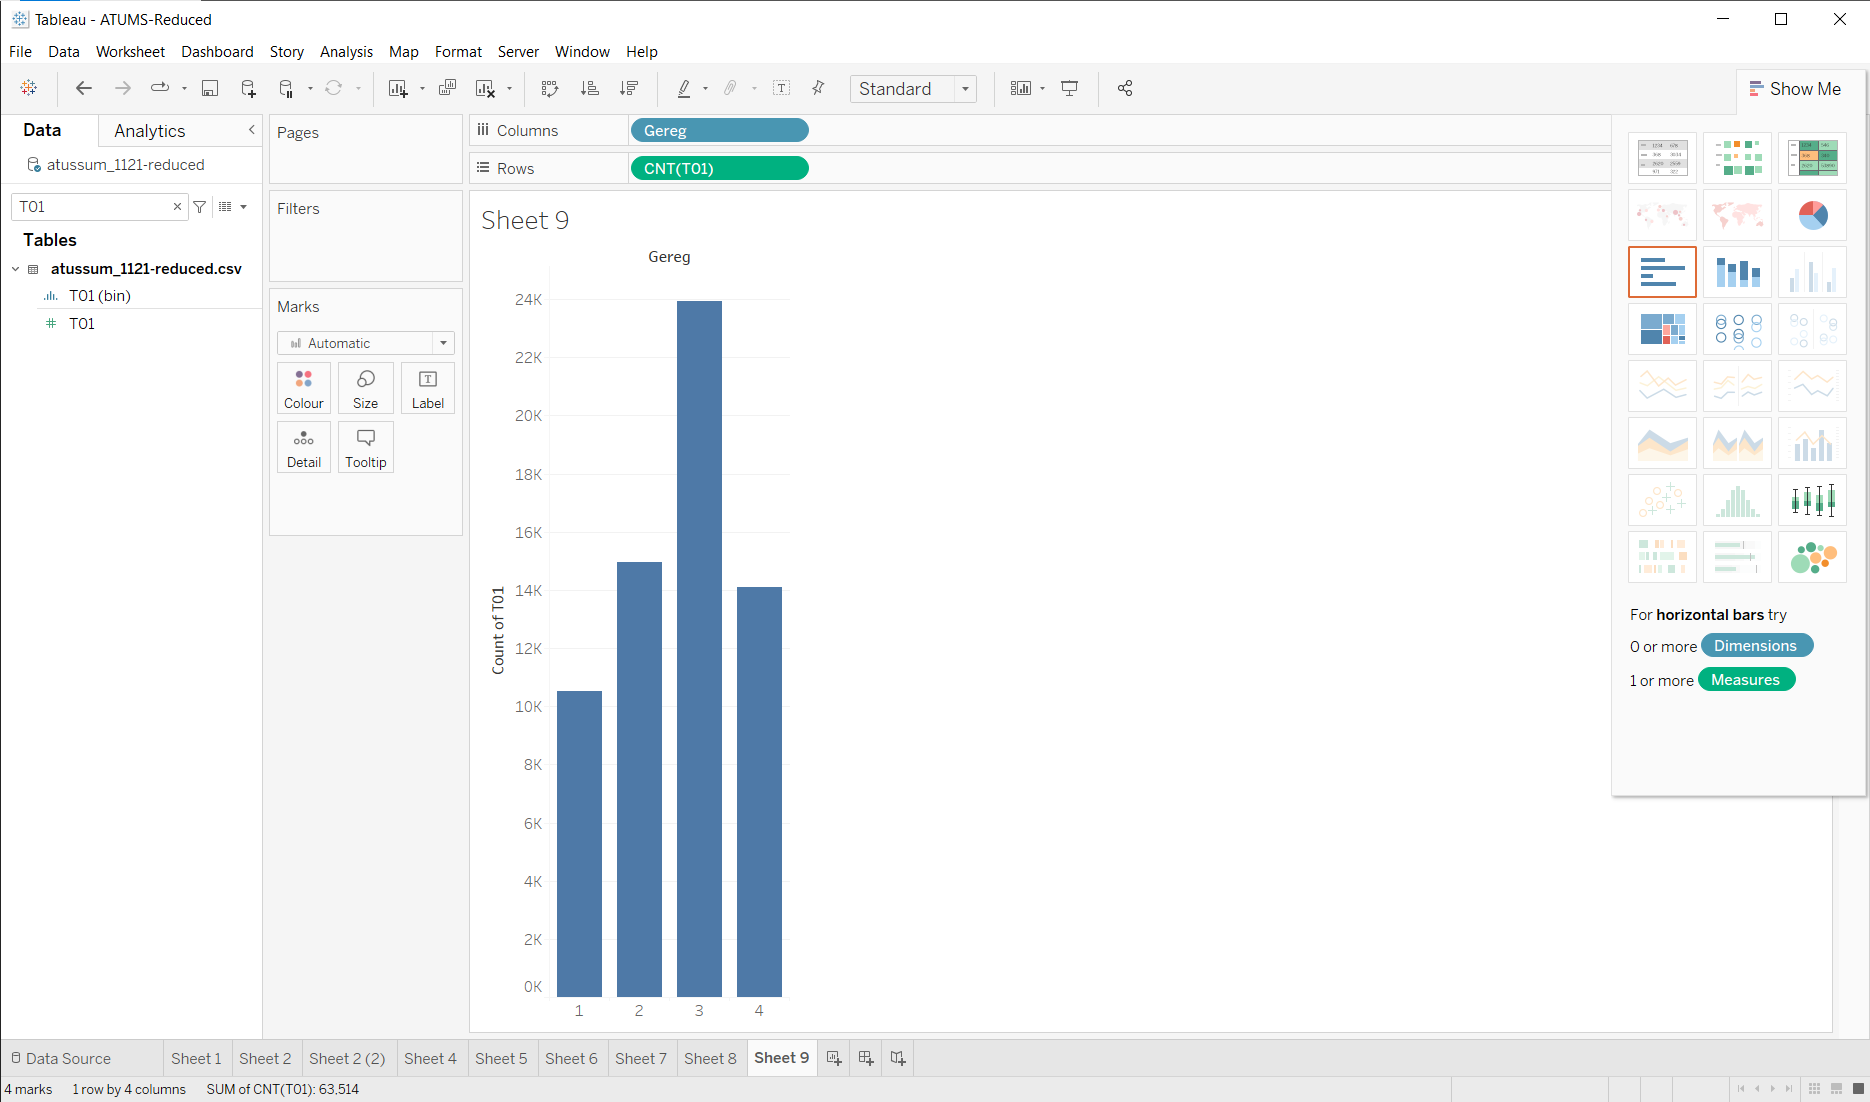
There are more people in region 3 (the south)
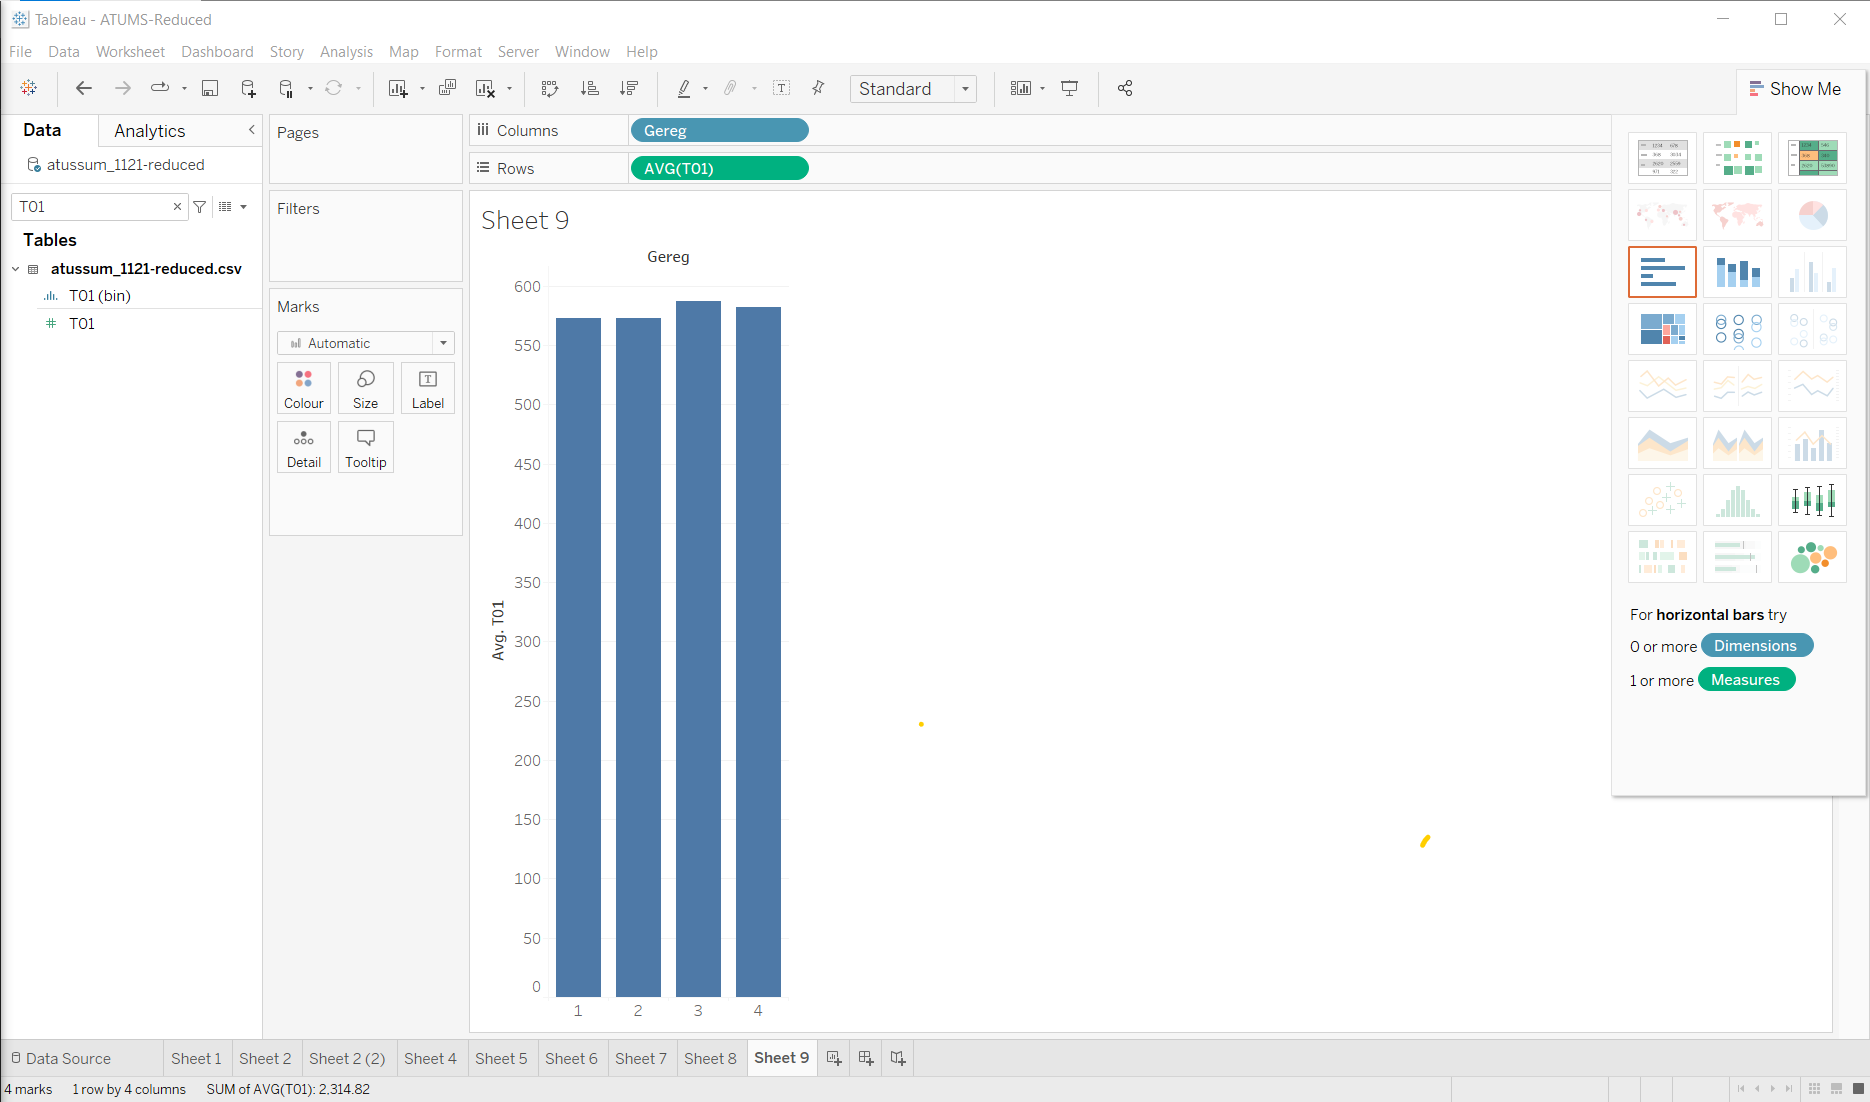
but the average amount of sleep (well, this is all “personal care” time - see A Quick EDA Example with the ATUS data) is about the same:
OK, I want to go exploring. You can see a little exploring (with and without the joined data) in A Quick EDA Example with the ATUS data - but you’ll get your own opportunity to do it soon with a design exercise!